


Market Wrap
Week Ending 3/07/08
Intro
Things are not looking too healthy in the financial markets. The Dow and the S&P got whacked for about a 3% loss on the week.
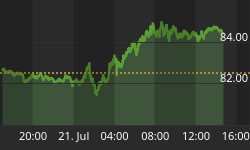
The Yen and the Swiss Franc are rising and the unwinding of the carry trades continues unabated. The U.S. markets are not alone to the downside as the chart below shows.

As stated in last week's report - the excess credit boom has led to unbridled asset inflation, which started to correct first in the real estate markets, and now is occurring in the stock markets, not only in the U.S., but around the world. More remains to come.
This is a bear market that has to do with credit and debt - the unsound pillars of a paper fiat money system. A paradigm shift is taking place from paper goods into real goods - commodities, things that hurt when you drop them on your foot.
Stagflation is beginning to take hold. The sixty-four dollar question is: will it remain as is, or morph into a hybrid creature? Unfortunately, the latter is highly probable.
This report has repeatedly harped on the credit/derivative/subprime debt debacle long before it became a household term, including the repercussions that would come from the unwinding of the carry trades, and the song remains the same.
Stocks
Charts of the financial and banking sector used to lead off the front page of the market wrap for months on end. The question was asked over and over as to how the stock market could possibly be starting a new bull market when the financials were all making new lows?
The general market has answered that question by falling in line down with the other sectors that started over the waterfall first. There is no longer any divergence or question - the long term direction is down.
Following are some charts that show the various U.S. stocks indices and there recent performance, as well as important support lines - some of which were broken this week, while others are being tested.
It appears that there is a bit more downside to this particular move before a rally occurs, but things are getting stretched to the downside. However, capitulation does not seem to have occurred just yet. Maybe, maybe not - next week should tell.
Keep an eye on the Japanese Yen and the Swiss France - if they rise, the market will continue down. If they fall - the markets will move up. The bond market has been the recipient of the blood letting in the street.


Bonds
The Fed's main concern is to protect the Treasury market. The State obtains money in one of two ways: they collect taxes or they borrow it - via the Treasury market - the debt market.
If the stock market goes down the Fed sees it as up an event the individual investor should worry about, but if the bond market goes down that is for the Fed to deal with, or loose their job.
The yield curve is getting steeper, short term rates are dropping faster than long term rates, as the charts below show. The long bond yield was up considerably for the week and is over its upper trend line.


The next chart compares the short end to the medium and long term end of the yield curve - from 30 Day T-Bills to 30 Year T-Bonds.
It clearly shows the short end of the curve dropping far more than the long end. It hasn't been a contest - it's been a slaughter.

The sixty-four dollar question is whether the yield curve will continue to increase its slope, or flatten out, or even recede. The latter is highly unlikely, which leaves either an increase or a flattening most likely.
First, recall that China and Japan buy almost half of the U.S. Treasury market. They must be kept happy or they will not continue to finance our ridiculous largess. Short term rates falling further would, therefore, seem to be on the Fed's to do list.
Long term rates coming down more than short term rates are doable, as long as short term rates continue to come down (bringing profits and smiles to China and Japan).
Which means for the yield curve to become "flatter", or perhaps we should say "less steep", long term rates would need to come down faster than short term rates.
It's possible, and it may be what the Fed wants; however, inflation or stagflation may make it a bit difficult to engineer. In the end - the market will win out - not the Fed.
Intervention is alive and well, it always has been, and always will be.
In the short to medium term it may win the day - the war, however, goes to the victor, and the market will ultimately decide, as it always does.
The market is a law unto itself. It can be put off, but it cannot be denied. That is like saying destiny can be denied, which is impossible, as it is the law.
To think otherwise is to accept that things happen by accident and not by order, which in itself would contradict that intervention can even occur, which it does - it's the magnitude that matters.
Everything is not black or white, there are shades as well. To not feed the beast is how it will weaken. Take what is justly available to reduce its fodder; and to replenish your own. One grows stronger - it becomes weaker.

Commodities
There is always something going up in price. As stated earlier, a paradigm shift is taking place out of paper assets and into hard assets - commodities.
This will accelerate with the new sovereign funds popping up around the world, especially in China. China will buy stuff - stuff they need to live, as will India, the Middle East, Russia and other nations.
The chart below shows this shift taking place - out of one thing and into another.
In the short to medium term, commodities have become extended, so a correction would not be a surprise, in fact it would be healthy and constructive from a longer term point of view.
Bull markets are in effect until proven otherwise. As of now, commodities are in a bull market unless the long term trend changes.
Weakness is to be bought. Strength is to be sold. Fear is to be embraced, complacency questioned.

Next up are some daily price charts for the Reuters Commodity Index, the DBC Commodity Tracking Index that includes commodities related to the production of food, which is rising in price around the world, and is going to continue to rise (stagflation), followed by natural gas and oil.
These charts are clearly overbought and are due for a correction. They are not something to rush out and buy at the present time. Patience will most likely be rewarded. The charts bear watching.


Gold
Gold was down $0.80 for the week to close at $974.20 for a -0.08% loss. Below is the daily chart.
RSI & histograms show negative divergence. MACD is starting to curl over. ROC is headed strongly down, suggesting further downside action.

Silver
Silver was up .33 cents to close at $20.25 for a weekly gain of +1.68%. This was another multi-decade closing high (weekly).
The daily chart shows RSI coming down from far into overbought territory. MACD appears to be starting to curl over.
Histograms are receding down towards zero and ROC has turned down sharply, suggesting further downside action is most likely.

Hui
The Hui added 1.26 points for the week to close at 487.33 (+0.26%) for another weekly closing high, but off its daily closing high of 502.17 made on Thursday.
Below is the daily chart. Both RSI and the histograms are flashing negative divergences. Price has backed off its recent all-time highs and is testing horizontal support (blue line).
MACD appears to be curling over. ROC has turned down sharply, indicating that more weakness is probable. Caution is warranted.

Next up is the weekly chart of the Hui. At the bottom of the chart is the ROC indicator (rate of change).
In bull markets, when ROC drops below zero (after a correction) and then turns up through zero (evidence correction is over), such moves have been the start of strong rallies back up - resuming the long term trend.
The red circles indicate the bottoms of corrections prior to such rallies. The blue circles show the oversold ROC readings coincident therewith.
The two have been connected by the vertical red lines to show the relation between the two.
Although hard buys - they have been the most profitable. Hard trades are usually the best trades; easy trades often turn quite quickly.

The point and figure chart of the Hui shows a double bottom breakdown occurring on Mar. 7, 2008, a short term bearish development.
A preliminary bearish price objective of 458 is given.

Next up is the P&F chart of the GDX Index. It has a bullish triangular breakout from Feb. 27, 2008 still in control.
The bullish price projection is 79. Currently the index is at 53.45, which gives a very strong price increase projection of about 50%.
This is in stark contrast to the Hui chart, although the Hui chart does not have a significant downside target at this time.

Invitation
The latest full-length version of the current week's market wrap is available only at our web site, including this week's stock chart watch list and any buys or sells executed this week.
Stop by our website and check it out. Most major markets are included with the emphasis on the precious metal markets.
There is a lot of information on gold and silver, not only from an investment point of view, but also from its position as being the mandated monetary system of our Constitution - Silver and Gold Coin as in Honest Weights and Measures.
On the main homepage are papers and articles by some of the best out there to be had. There are audio and videos on banking, the Constitution, and cutting edge news. Many articles are archived and others are linked.
Live time quotes on gold and silver and precious metal stocks are available, including charts for most world currencies and futures.
Links to the World Bank, Central Banks, the International Monetary Fund, the United Nations, the Bank for International Settlements, and many other similar and different sources are available.
There is also a live bulletin board where you can discuss the markets with people from around the world and many other resources.
Drop by and check it out. Good luck. Good trading. Good health. And that's a wrap.

Come visit our new website: Honest Money Gold & Silver Report
New Book Coming in 2008 - Honest Money


