Today we will look at the VIX, volatility levels, and the short term action on the S&P 500 index.
The VIX often gives good confirming clues about the market's direction, but it takes a keen ability in properly drawing support and resistance lines.
As you will see in today' chart below, the market correlations very good ... and worth the effort of tracking the VIX.
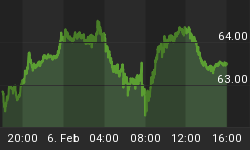
Since the VIX moves "opposite to the market", I INVERTED the VIX on this 60 minute chart so it would correlate with the movements on the S&P 500.
If you spend a minute just observing the chart, you will see why tracking the VIX is an important tool.
One of the typical "behaviors" exhibited on the VIX is what happens relative to gap up or gap down events.
Look at the chart, and observe that when a gap occurs on the VIX, it typically confirms the shift of direction on the S&P 500. Sometimes, the VIX gap occurs before the directional change on the S&P. That happened at the end of December last year.
Note that gap was never filled ... until 2 PM on Monday afternoon of this week. The VIX then was not able to move past that point. At the same time, the S&P reached and tested its 2008 resistance line ... and retreated upon testing it.
What to look for now ...
The Gap has been filled. So now the big test is facing the VIX and the S&P 500 at the same time.
For a upside continuation of the market's movement, we will now want to see the S&P move ABOVE its resistance line, and for the VIX to move above its resistance line. Preferably, you want to see the VIX gap below a level of 21 for a confirmation. (Don't forget that I inverted the VIX on this chart!)
(Not a paid subscriber yet? If you find these kinds of unique analyses beneficial, why not consider become a one of our paid subscribers?)


