


The following article was originally published at The Agile Trader on April 13, 2008. If you would like a free one-month trial to our twice-daily service, please click HERE and then click the red "subscribe" link at left.
Dear Speculators,
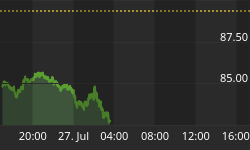
General Electric's (GE) earnings report on Friday morning threw the market for a loop. The company's earnings miss (missed by $0.07, reporting $0.44) along with its negative guidance ($2.20-2.30 for FY08, down from a prior consensus of $2.43), tanked the stock by about 12.8%.

That's the largest one-day decline since October 19, 1987 (almost 18% that day). The sell-off puts the stock right around its March low and well below its broken downtrend line. (Look at the jump in volume! That's 6-7 times average!)
Given that this stock has had the 2nd largest market capitalization in the US stock market (and a 2.8% weighting in the SPX), the 13% one-day sell-down is a serious event. (GE's one-day decline alone, without its knock-on effects on other stocks, took the SPX down 0.36% on Friday.)
GE's CEO, Jeff Immelt, reported that the earnings miss was precipitated by severe disruption in the capital markets, which hindered the company in completing asset sales. Moreover, higher mark-to-market losses accounted for $0.05/share in losses, which is more than 70% of the miss.
Is it any wonder that the credit markets have seen very little subsiding of the stress they've been expressing?
The ABX Index, which tracks the mark-to-market price of a recently issued tranche of Triple A mortgage bonds, has rallied up from its downside target price in the 52-53 range, up to 56.

So far we have a "dead-cat bounce" and not much more; the multi-month downtrend on this chart has by no means been definitively broken. It will take a much stronger and more sustained strengthening in these sorts of mortgage-related securities to represent a significant improvement in the level of confidence investors have in the stability of the financial markets.
Likewise, the TED Spread (the difference between the 3-month LIBOR yield and the 3-month Treasury yield) remains quite elevated. Normally the TED Spread, which measures the excess yield that banks demand in order to risk lending to other banks (compared to the risk-less Treasury yield) is below 1%. And, while this spread is down from its triple top above 2%, it remains high, now at 1.45%.

While the Fed's liquidity-pumping has eased the stress somewhat, it has not (so far) succeeded in inducing banks to trust what's on each others' books. The risks of lending are still perceived to be high.
The anxiety visible in the previous 2 charts (as well as in the GE chart) is also still visible in the 5-Yr Treasury Inflation Protected Securities (TIPS) chart. While, again, there is some slight improvement recently, recessionary fears remain rampant.
The black line on this chart shows the SPX. The lavender line represents the 5-Yr Treasury yield, which, like the SPX, has been declining since the middle of '07. The red line shows the Breakeven Inflation Rate (the market's aggregate expectation for annual CPI inflation over the next 5 years). And the blue line shows the TIPS Real Yield, which is roughly a proxy for the market's consensus view of annual real GDP growth during this period.

The Breakeven Inflation Rate (red) remains confined to a very low, narrow range, just above 2%. There is no great expression in this chart of anxiety about rising inflation.
By contrast, the Real Yield remains extremely depressed, below 0.5%, and locked below its line of declining tops. As I've discussed at length before, since 1950 the worst 5-yr period for real economic growth has averaged +1.6%. Moreover, with commodity prices soaring, and with the Chinese Yuan appreciating against the dollar (making imports more expensive) there's a darn fine case to be made for the notion that the TIPS market is discounting as too low both growth and inflation. If so, then the flight to quality (which pushes money into bonds) has generated a bubble...in this case, a bubble in ostensibly "safe" assets.
It would appear that, over the coming 5 years, the odds are quite high that either growth or inflation will be considerably higher than currently discounted. And it may well be that both growth AND inflation will be higher than the TIPS market now believes.
If I'm right about this, then bonds will get significantly cheaper over the next couple of years.
EARNINGS
We have come to an interesting time of year for our chart of SPX earnings per share. Standard & Poors has just released their bottom-up projections for 2009. So, we have to begin using these projections rather than either the top-down projections or our own projections of trends. And each year at around this time, the release of this data causes some turbulence. Here's what I mean.
The blue line in the chart below tracks forward 52-week earnings per share. Since the beginning of the year, however, we have mainly been including estimates for flat earnings growth for 1Q09 and 2Q09...until recently when S&P released their top-down estimates. But now, with the release of '09 bottom-up numbers, look what has happened to the blue line (colored red this week for emphasis). It jumped up in one week from $95.05 to $102.30.

Obviously we have to find a way to better account for these estimates at this awkward time of year. And I'm in the process of refining my database to do just that. But for the time being, we have to be aware that there is a significant disparity between what these 2 different types of analysts are saying about what earnings are going to look like. And it is just this kind of uncertainty that leads to wild market fluctuations, such as those we have recently seen.
(Note: Trailing Operating Earnings (yellow line) have leveled off lately. However, Trailing Reported earnings (pink line, and which include more one-off write-downs) continue to deteriorate.)
Returning to the disparity between top-down and bottom-up estimates, this next chart plots the quarterly consensus for each.

As you can see, the macro guys (top-down, blue) are much more pessimistic than the company-specific researchers (bottom-up, dark magenta).
The consensus for trailing 52-wk earnings per share among the top-down guys (not charted) is for $77.60. By contrast the bottom-up guys say $81.27. (The difference is in their estimates of what 2Q08 will turn out to be). And the consensus for forward 52-wk earnings per share among top-down guys (also not charted) is for $76.10 (a decline of 2%), compared to the $102.30 consensus (growth of 26%) among the bottom-up guys.
How to reconcile these disparities, especially in forward earnings estimates? That will take further study. My work to date with forward earnings has largely been with bottom-up estimates, and over the past 14 years these estimates have turned out to be anywhere from 35% too high to 12% too low.
On this chart the SPX is plotted in black. In red we see the difference between what operating earnings turned out to be, compared to what the bottom-up consensus had been a year earlier. So, for example, if the red line is at -10%, then trailing operating earnings ended up being 10% below where the consensus had been a year before.

The yellow highlights point out times when the red line was falling hard at the same time that the market was struggling (and we are currently in one of those periods). But the relationship is by no means a simple one, and many other factors obviously enter into play in determining market direction.
Finally, with the publication of estimates for '09, we can now have a gander at the consensus for forward 52-wk EPS on a sector-by-sector basis. (In this space we have recently been looking at the '08 consensus, but this time-weighted series stretches out a full year ahead.)

As you can see, the obvious problem is in the financial sector (light blue). Beginning in July '07, the consensus in that sector topped out and began deteriorating at the same time that projections for the energy sector launched into a new uptrend. And that's about the same time that the broad market began its topping-out process in earnest. (Coincidence? Probably not.)
We see positive trends in forward earnings for Energy, Health Care, Industrials, Information Technology, and Consumer Staples. There have recently been some wobbly periods for estimates in Materials, Consumer Discretionaries, and Telecom Services. Utilities have been pretty flat in terms of projected earnings trends.
In the context of the bubble in bond prices (discussed above), the yield on the 10-Yr Treasury is now 3.47%. Meanwhile, using the bottom-up consensus for forward earnings ($102.30), the forward earnings yield on the SPX is 7.68%. The difference between these 2 yields (7.68%-3.47% = 4.21%) is what we call our Equity Risk Premium and represents the excess yield that investors are demanding in order to assume the risk of investing in stocks (compared to investing in risk-free Treasuries). That's the highest ERP since 1979.

The markets are currently braced for the worst economic crisis since the Great Depression. With the Fed pumping liquidity into the economy and focused on specifically averting just such an outcome, my own suspicion is that we will not see an economic crisis on that kind of scale. (And by the way, last week was the first time I heard someone in the financial media say, "Don't fight the Fed." So, perhaps we are approaching some kind of turning point.)
GE's earnings disappointment may speak to a rough earning season that will kick into high gear this week. And perhaps bottom-up forward estimates will fall in the weeks ahead. So, as discussed 2 weeks ago in this space, it's possible that we are still forming the "left" side of an important market low rather than the "right" side. But, with bonds so expensive (yielding less than 3.5%) and stocks so cheap (SPX forward earnings yield of 7.68%, and a PE on those forward earnings of 13, which is the lowest since March 1995), I continue to suspect that we are in the process of forming an important market low.
If you would like a free one-month trial to our The Agile Trader service, please click HERE and then click the red "subscribe" link at left.
Best regards and good trading!


