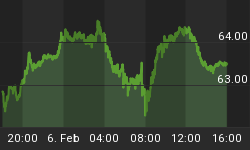
"...The infamous Dow/Gold Ratio just touched its long-run historic average. So which way next amid the Fed's inflationary melt-up...?"
IF WALL STREET STOCKS can surge 160 points on falling earnings, an 11% drop in housing starts, and a 16-year record for consumer-price inflation, then so can everything else that doesn't carry a picture of George Washington.
Crude oil, rice, Gold, the Euro, wheat, emerging market bonds, copper...anything that's not stamped with the all-seeing eye of the Dollar looks a great bet once again. The Federal Reserve has seen to that, driving the real returns paid to cash down towards a three-decade low.
Sinking to minus 2.05% in March, the real rate of interest nearly equals the very worst returns-to-cash paid during the Great Greenspan Reflation of 2002-2005. This latest slump in real interest rates also comes thanks to "emergency" rate cuts, too.
Plus, of course, the worst run for Consumer Price rises since the start of 1992. And here at BullionVault we think the two are more closely related than the Olsen twins.

Rates down, inflation up? Well, what else did savers and retirees expect...? The Fed can't promise to forestall recession forever. But by God it will try!
So for the meantime, at least, there's truly no fear of deflation here.
Whatever happened to the Fed Committee's much-expected "moderation" of inflation? Running at 4.3% yet again in March, the CPI just put in its longest stretch above 4.0% in 16 years.
Where's the "projected leveling-out of energy and other commodity prices" it promised only last month? Crude oil today broke fresh records above $114 per barrel and rice prices - worldwide - have doubled from where they stood in October.
It's not just US cash savers being eaten alive, of course, by sub-zero rates of real interest. Here in London, the real returns paid to savings after tax and inflation have sat in the red for the last five years running. The latest shop-price data from Europe now shows a 12-year record for German consumers, giving the lie to "inflation vigilance" at the European Central Bank.
But the sudden bull market in everything really stands out in Dollar terms. And hoarding cash - the true meaning of "deflation", as well as the root cause of the current worldwide crisis in banking - has become a sure route to the poor-house again.
How to choose the best bolt-hole for your savings and wealth? Clearly real estate's doomed, for the short to mid-term at least. Government bond yields are now so far underwater, you'd be killed by the bends if they tried to come up for air.
That leaves commodities and stocks, the classic refuges for inflationary crises. And one way of judging the Dow - free from all Dollar distortions - is to measure the index in terms of gold ounces.

Dividing the Dow Jones Industrial Average by the price of gold gives you a rough idea - over time - of where the real value might lie. It shows how many ounces of gold you would need to buy one unit of Dow stocks.
Hence gold was a raging sell (in hindsight at least) when the Dow/Gold ratio touched 1.0 at the start of the 1980s. Stocks scarcely looked back for the next 20 years. But by the end of the '90s, the real value had shifted again. And gold surged as the Dow sank after the Tech Stock Crash of 2000.
That slump in stock prices compared with Gold pushed the Dow/Gold ratio down from its all-time top above 42.2 to just 12.6 in March of this year.
That's pretty much exactly the Dow/Gold average of the last eighty years. So which way will the ratio go now?
The Fed's new "reflationary melt-up" is clearly designed to keep stock prices buoyant. But it's only adding to the Case for Gold, too. "I would be very surprised if the Dow Jones Industrials/Gold Ratio didn't decline to between 5 and 10 within the next three years," said Marc Faber of the Gloom, Boom & Doom Report recently.
If that call proves right, it might come thanks to Gold Prices doubling, or stock prices halving, or more likely some combination of both. But while the three peaks to date - of Aug. 1929, Jan. '66 and then late '99 - took the Dow/Gold's top higher, the floor only held steady, down there at two ounces of gold and below.
And the last slump - during the inflationary 1960s and stagflationary '70s - took a full 14 years to work itself out. So far in this bear market for the Dow/Gold ratio, we're nine years through to date.


