"No warning can save people determined to grow suddenly rich" - Lord Overstone
 |
Gold •748 days | 2,368.70 | +35.30 | +1.51% |
|
Platinum •20 mins | 1,632.80 | +28.80 | +1.80% |
|
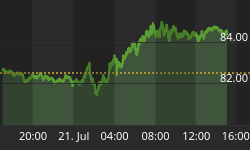
WTI Crude •11 mins | 84.37 | +1.89 | +2.29% |
|
Gasoline •11 mins | 3.406 | +0.017 | +0.50% |
|
Ethanol •748 days | 2.161 | +0.000 | +0.00% |
|
Silver •748 days | 30.82 | +1.16 | +3.92% |
 |
Silver • 748 days | 30.82 | +1.16 | +3.92% | |
|
Copper • 748 days | 4.530 | +0.111 | +2.51% | |
|
Brent Crude • 11 mins | 91.07 | +1.85 | +2.07% | |
|
Natural Gas • 11 mins | 2.865 | +0.005 | +0.17% | |
|
Heating Oil • 11 mins | 4.127 | +0.008 | +0.19% |
Barclay T. Leib

Contributor since: 26 Feb 2010
-
No Endgame Except for Sand Spring
If there is one historical analog pattern that may match our view of U.S. equities the best, it is the period between early 1947 to…
-
All Hail Rigged Markets and A Look Back at the 1862-1878 Period
Although I think overall we may be in an inflationary "Type 1" decade per my 2001 article, in the very short term (next 6-8 months…
-
The Push-Pull of 2005: Horror Filled -- At Least from Hollywood
There has been a real push-pull struggle in 2005 financial markets that has felt very much like a "giant tease." When we penned our February…
-
Measuring Financial Time: The Magic of Pi
"This analysis originally appeared Feb 25, 2001 on Sandspring.com. It is a long term look at cyclical equity market rhythms, but now four months old,…
Sign up to the
Safehaven Market Insider


