"No warning can save people determined to grow suddenly rich" - Lord Overstone
 |
Gold •742 days | 2,368.70 | +35.30 | +1.51% |
|
Platinum •15 mins | 1,678.60 | +36.90 | +2.25% |
 |
WTI Crude •11 mins | 79.56 | -0.04 | -0.05% |
|
Gasoline •20 mins | 3.286 | -0.015 | -0.46% |
|
Ethanol •742 days | 2.161 | +0.000 | +0.00% |
|
Silver •742 days | 30.82 | +1.16 | +3.92% |
 |
Silver • 742 days | 30.82 | +1.16 | +3.92% | |
|
Copper • 742 days | 4.530 | +0.111 | +2.51% | |
|
Brent Crude • 11 mins | 84.79 | -0.16 | -0.19% | |
|
Natural Gas • 11 mins | 2.907 | -0.017 | -0.58% | |
|
Heating Oil • 18 mins | 3.954 | +0.006 | +0.14% |
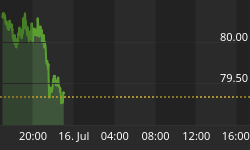
Chart of the Week

Contributor since: 26 Feb 2010
-
Time for a Test of the Lows?
The other side of the mountain! Chart Courtesy of Stockcharts
-
Rally Time For The CRB?
Chart Courtesy of Stockcharts
-
A Breakout For Gold?
Chart Courtesy of Stockcharts
-
Next Test 11,000?
The 11,000 area should present formidable resistance for the current silliness. Chart Courtesy of Stockcharts
-
Easter Break?
The weeks prior to Easter gave investors a break from the "Bear Market"; BUT if the Dow Industrials cannot move above the 10,290 range, the…
-
Losing Interest
We think bonds are about to enter a "Bear Market" Chart Courtesy of Stockcharts
-
Picking Gold Bottoms
We think the 21 year "Bear Market" will end this year. But where it ends NO ONE KNOWS !
-
A Bull Market in Cash
Dow Jones World Stock Index - Inverted While the media muses whether the DOW has entered a mystical 20% "Bear" market, "Cash" is enjoying a…
-
Critical support for the Bullish Case
Chart Courtesy of Stockcharts
-
The Value Line Arithmetric Index
Ignored by analysts during the Bull Market - ignored so far by the Bear! Chart Courtesy of Stockcharts
-
The Greenspan 'Bubble' Legacy
Pump, Pump, Pump! Chart Courtesy of Economagic
-
If The Neckline Breaks
Wilshire 5000 Index If the neckline breaks, support will become resistance. Chart Courtesy of Stockcharts
-
The Bear Market Continues
Dow Jones World Index Chart Courtesy of Stockcharts
-
The New Buzzword - A 'V' Bottom
Here is a large "V" Bottom Chart Courtesy of Lowrisk.com
-
New Era Fed Tightening
Chart Courtesy of Economagic
-
US Dollar - Another Leg Down?
Ready for another leg down? Chart Courtesy of Stockcharts
-
The Rising Wedge of Merrill Lynch
A break below $ 72.00 has greater bearish implications! Chart Courtesy of Stockcharts
-
How Much Does $1 Billion Buy
Alan M. Newman Editor, HD Brous & Co., Inc.'s CROSSCURRENTS HD Brous & Co., Inc.'s CROSSCURRENTS website HD Brous & Co., Inc. CORPORATE website
-
Keep your Eyes on GE
Chart Courtesy of Stockcharts
-
The US Dollar Breaking Down
Chart Courtesy of Stockcharts
Sign up to the
Safehaven Market Insider


