"No warning can save people determined to grow suddenly rich" - Lord Overstone
 |
Gold •747 days | 2,368.70 | +35.30 | +1.51% |
 |
Platinum •10 mins | 1,599.40 | -4.60 | -0.29% |
|
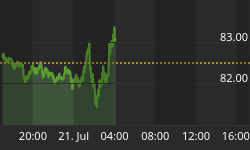
WTI Crude •11 mins | 82.31 | -0.17 | -0.21% |
|
Gasoline •40 mins | 3.381 | -0.008 | -0.23% |
|
Ethanol •747 days | 2.161 | +0.000 | +0.00% |
|
Silver •747 days | 30.82 | +1.16 | +3.92% |
 |
Silver • 747 days | 30.82 | +1.16 | +3.92% | |
|
Copper • 747 days | 4.530 | +0.111 | +2.51% | |
|
Brent Crude • 11 mins | 88.62 | -0.60 | -0.67% | |
|
Natural Gas • 13 mins | 2.845 | -0.015 | -0.52% | |
|
Heating Oil • 17 mins | 4.111 | -0.008 | -0.19% |
FAST Graphs

Contributor since: 04 Apr 2012
Biography
F.A.S.T. Graphs™ is a powerful research tool providing "essential fundamentals at a glance" on over 17,000 symbols. F.A.S.T. Graphs™ empowers the user to research stocks deeper and faster by allowing them to exploit the undeniable relationship and functional correlation between long-term earnings growth and market price. Warren Buffett, the greatest capital allocator of all time, said; "there are only two things that investor needs to know; how to value a company and how to think about stock prices." With the F.A.S.T. Graphs™ at their disposal, users are able to perform both of these critical tasks... FAST.
F.A.S.T. is an acronym for Fundamentals Analyzer Software Tool that takes all the hours of manual graphing of business fundamentals and reduces it to seconds, giving you critical information in an instant. With one glance you know a lot about the business you are graphing and its past, present and future value. F.A.S.T. Graphs™ should be the first step in every research project. Each graph is worth 1,000 words in describing a company's growth, consistency and valuation.
-
American Telephone and Telegraph: Compelling Even Without Growth
AT&T is one of the largest and most recognized companies in the world. Due to its size, the overall expected growth prospects are rightfully subdued.…
-
Taking A 'FUN' Look At Kimberly-Clark
Kimberly-Clark is a storied company and often a reasonable investment opportunity based on ordinary metrics. Frequently investors view these few basic metrics and come to…
-
Medtronic: A Lesson On Reasonableness Despite New Highs
People tend to lump all companies together as "stocks" and today the general characterization is that stocks are "expensive." While it is true that Medtronic…
-
Microsoft: The Progression Of A Maturing Business
Everyone is keenly aware of the $300+ billion dollar company that is Microsoft (MSFT). From the classic Windows and Office products to the latest Xbox…
-
Chicago Bridge and Iron: A Solid Company With An 'Out Of Whack' Dividend
Chicago Bridge & Iron has grown earnings per share by about 16% a year since 2000. The dividend history has been largely inconsistent - with…
-
U.S. Bancorp: Don't Forget About This Fair Valued Bank
If you were to survey the field to name major banks, we're guessing that U.S. Bancorp (USB) wouldn't top too many lists. Instead, the likes…
-
The Buckle: Something 'Special' For Your Portfolio
Here's an interesting bit of investing trivia: had an investor picked up shares of The Buckle (BKE) - a midscale casual apparel retailer - at…
-
Johnson Controls: Back To Consistency?
Johnson Controls (JCI) traces its roots back to an interesting bit of history. One hundred and thirty-one years ago, Warren Johnson was a professor in…
-
General Mills: Close To Being Generally Interesting
When thinking about General Mills (GIS) you likely associate the company with its flagship cereal brands like Cheerios, Wheaties and Lucky Charms - Cheerios alone…
-
Wells Fargo: A Lesson In Dealing With Fear
What would you do if we told you that a financial crisis was coming? Specifically, let's drill down to a single bank stock and say…
-
PepsiCo Dividend: Refreshing The Investor World
On February 13th of 2014 PepsiCo (PEP) announced - in addition to earnings - its expected returns to shareholders in the coming year, an update…
-
Archer Daniels Midland: The World Needs To Eat
Illinois based Archer Daniels Midland Company (ADM) traces its roots back over 110 years to a partnership between George Archer and John Daniels in 1902;…
-
Is Ingredion The Missing Ingredient In Your Portfolio?
Illinois based Ingredion (INGR) is a global ingredient solutions provider to the food, beverage, brewing and pharmaceutical world. Think corn, wheat and potatoes being turned…
-
Macy's 'Way To Shop' For A Discount
With the holiday season in full force, it's likely that many of you have browsed your fair share of shopping aisles. Now this could -…
-
Stanley Black and Decker: Powering Its Way Toward Fair Value
Stanley Black & Decker (SWK) is a machine tools company built on namesakes of - you guessed it - three individuals with the last names:…
-
Aflac: Still Cheap Despite The Recent Price Run-Up
Georgia based Aflac (AFL) is probably best known among the general public for the Aflac duck parading about television commercials. However, investors probably know Aflac…
-
Wal-Mart: Fairly Valued Retail Powerhouse
This Bentonville, AR based mega-retailer perennially ranks amongst the top of the Fortune 500 list and likely needs no introduction. In lieu of a business…
-
Accenture: Continuing To Deliver A Growth Story
Accenture (ACN) is a global management consulting, technology services and outsourcing company with approximately 275,000 people serving clients in more than 120 countries. As of…
-
Penske Automotive Group: Fast Cars, Fast Growth
If we told you about a company that saw earnings per share drop by nearly half - from $1.49 a share to $0.86 - during…
-
General Dynamics: Short-term Uncertainty, Long-term Opportunity?
General Dynamics (GD) is a leading business aviation, combat vehicle, weapons, marine and information system company. Founded in 1952, General Dynamics has integrated and acquired…
Sign up to the
Safehaven Market Insider


