 |
Gold •583 days | 2,368.70 | +35.30 | +1.51% |
 |
Platinum •10 mins | 2,099.40 | +28.80 | +1.39% |
 |
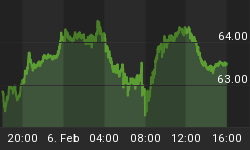
WTI Crude •16 hours | 63.55 | +0.26 | +0.41% |
 |
Gasoline •16 hours | 1.953 | +0.027 | +1.38% |
 |
Ethanol •583 days | 2.161 | +0.000 | +0.00% |
 |
Silver •583 days | 30.82 | +1.16 | +3.92% |
 |
Silver • 583 days | 30.82 | +1.16 | +3.92% | |
 |
Copper • 583 days | 4.530 | +0.111 | +2.51% | |
 |
Brent Crude • 15 hours | 68.05 | +0.50 | +0.74% | |
 |
Natural Gas • 16 hours | 3.422 | -0.087 | -2.48% | |
 |
Heating Oil • 16 hours | 2.413 | +0.020 | +0.84% |

Ron Griess
Contributor since: 26 Feb 2010
-
Crude Oil - Who to Believe?
This commentary was originally posted at TheChartStore on 4th April 2005: In our July 21, 2004 Observations, we posted a series of inflation-adjusted crude oil…
-
Commodity Prices - Bubble Top or More to Go?
In this Observation, we are going to use the Reuters/CRB Futures Index (CRB) as our proxy for commodity prices. We will point out what might…
-
Ripples in Time - An Update
The following chart updates the last chart of our January 9, 2005 Observation. We have added some additional time cycles represented by the orange numbers…
-
Ripples in Time - Cycle Analysis of the S&P 500
This analysis was originally published by The Chart Store on January 9, 2005. The charts have been updated through February 11, 2005. Among the many…
-
A Look at the First Five Days of the Month Indicator and the January Effect
It is January. Must be time to dust off the old "first five trading days of January indicator" and follow that with the "January Effect."…
-
Just Following the Money
No, we're not talking about some investigation into a political or corporate scandal. We are talking about the flow of funds into corporate equities and…
-
Presenting a Positive Case for the Stock Market in 2005
In this Observation, we examine some historical trends of the stock market. It is an attempt to use many of the charts available on our…
-
Post Election Years - The Historical Record
In this Observation, we examine the historical record of the Dow Jones Industrial Average (DJIA) in the calendar year following an election. We begin with…
-
Time for a Pause - A Look at 10 year U.S. Treasury Yields
This article was originally published on The Chart Store Observation area for subscribers on August 21, 2004. One of the indicators used by technical analysts…
-
Setting the Table - A Look at Gold
This article was originally published on The Chart Store Observation area for subscribers on August 23, 2004. We pointed out in our July 21 Observation…
-
Crude Oil - A View from a Different "Angle"
This article was originally published on The Chart Store Observation area for subscribers on July 21, 2004. The email version was sent to the AAPTA…


