"No warning can save people determined to grow suddenly rich" - Lord Overstone
 |
Gold •754 days | 2,368.70 | +35.30 | +1.51% |
 |
Platinum •10 mins | 1,607.90 | -24.30 | -1.49% |
|
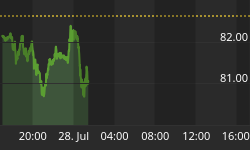
WTI Crude •11 mins | 82.07 | -0.54 | -0.65% |
|
Gasoline •1 hour | 3.323 | -0.004 | -0.12% |
|
Ethanol •754 days | 2.161 | +0.000 | +0.00% |
|
Silver •754 days | 30.82 | +1.16 | +3.92% |
 |
Silver • 754 days | 30.82 | +1.16 | +3.92% | |
|
Copper • 754 days | 4.530 | +0.111 | +2.51% | |
|
Brent Crude • 11 mins | 87.63 | -0.73 | -0.83% | |
|
Natural Gas • 11 mins | 2.727 | -0.040 | -1.45% | |
|
Heating Oil • 12 mins | 4.140 | +0.028 | +0.68% |
Vitali Logman

Contributor since: 26 Feb 2010
Biography
SilverStrategies.com provides news, analyses, reports and general information in a single internet destination that we hope will be invaluable to anyone with an interest in silver, the precious metal seemingly forgotten by the investment mainstream.
-
Silver and $XAU Weekly Charts
On 6 year chart Silver looks very strong, all major trends are UP and intact. 2006 Spring-Summer correction holds above reasonable support lines which are…
-
Gold-Silver Ratio and the Outlook at Housing in Silver Terms
GOLD-SILVER Ratio since 1981: The ratio decisively CHANNELED-DOWN below the historical UP-Trend keeping the major DOWN-Trend intact; that makes Long-Term investment in SILVER more attractive…
-
$XAU Technical Condition
3 Year Chart: What we know is that the Gold & Silver Index is still above its major support level despite the recent HEAVY SELL-OFF;…
Sign up to the
Safehaven Market Insider


