


Wednesday's trading session was pretty uneventful as stocks fluctuated following Tuesday's advance. The S&P 500 index remains close to its Tuesday's new record high of 2.,873.23. But will it continue higher? Or is this a topping pattern before downward reversal?
The U.S. stock market indexes were mixed between -0.3 percent and +0.4 percent on Wednesday as investors took some short-term profits off the table following the recent advance. The S&P 500 index reached the new record high at the level of 2,873.23 on Tuesday, as it broke slightly above its January's 26th high of 2,872.87. The Dow Jones Industrial Average lost 0.3 percent and the technology Nasdaq Composite gained 0.4 percent yesterday.
The nearest important level of support of the S&P 500 index is at around 2,860, marked by Tuesday's daily gap up of 2,859.76-2,861.32. The next support level is at 2,830-2,835, marked by some short-term local lows. The support level is also at 2,825-2,830, marked by the last Thursday's daily gap up of 2,827.95-2,831.44. On the other hand, the level of resistance is at 2,870-2,875, marked by the record high. Potential resistance level is also at 2,900.
The broad stock market reached the new record high on Tuesday, as it broke slightly above its late January high. Will the S&P 500 index continue higher? There are still two possible medium-term scenarios - bearish that will lead us towards the February low again, and the bullish one - breakout higher towards 3,000 mark. The latter one got very real recently:

(Click to enlarge)
Mixed Expectations
The index futures contracts trade between -0.02 percent and +0.04 percent vs. their Wednesday's closing prices. So expectations before the opening of today's trading session are virtually flat. The main European stock market indexes have been mixed so far. Investors will wait for some economic data announcements today: Initial Claims at 8:30 a.m., Flash Manufacturing PMI, Flash Services PMI at 9:45 a.m., Consumer Confidence, New Home Sales at 10:00 a.m. The broad stock market will probably open virtually flat today. We may see more short-term fluctuations following the recent run-up. There have been no confirmed negative signals so far. However, we can see some selling pressure at the medium-term resistance level. Related: Money Talks As China Reacts To Taiwan’s Global Tour
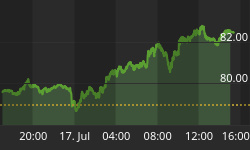
The S&P 500 futures contract trades within an intraday consolidation, as investors hesitate following Tuesday's intraday decline. The market trades relatively close to its short-term local high of around 2,873. The nearest important level of support is at around 2,845-2,855, marked by the recent fluctuations. The support level is also at 2,835-2,840. On the other hand, the resistance level is at around 2,870-2,875. The futures contract continues to trade above its short-term upward trend line, as we can see on the 15-minute chart:

(Click to enlarge)
Nasdaq Above 7,400 Again
The technology Nasdaq 100 futures contract follows a similar path, as it trades within an intraday consolidation along its recent local highs. The nearest important level of resistance remains at around 7,420-7,450. The next resistance level is at 7,470-7,500, among others. On the other hand, level of support is at 7,400, and the next support level is at 7,350-7,370. The Nasdaq futures contract trades above 7,400 mark this morning, as the 15-minute chart shows:

(Click to enlarge)
Big Cap Tech Stocks - Mixed Picture Again, Yet Close to Record Highs
Let's take a look at Apple, Inc. stock (AAPL) daily chart (chart courtesy of http://stockcharts.com). It reached the new record high at the level of $219.18 on Monday. Since then it is slightly declining. There have been no confirmed negative signals so far. However, we may see a downward correction at some point. The nearest important level of support is now at $205-210, marked by the recent consolidation:

(Click to enlarge)
Now let's take a look at Amazon.com, Inc. stock (AMZN) daily chart. It reached the new record high in the early August at the level of $1,925.00. Since then it traded within a short-term consolidation.
Related: American Dream In Jeopardy As Student Loan Defaults Soar
The stock got closer to the record high yesterday. But will it continue higher today? The nearest important level of resistance remains at around $1,925. On the other hand, support level is at 1,850:

(Click to enlarge)
Dow Jones Slightly Lower
The Dow Jones Industrial Average reached the new local high on Tuesday, as it extended its last week's rally following breaking above its early August local high. The blue-chip stocks' gauge was relatively weaker than the broad stock market yesterday, as it retraced some of its recent advance. However, there have been no confirmed negative signals so far. We can see some short-term overbought conditions, so the market may fluctuate along its local highs for a while:

(Click to enlarge)
The S&P 500 index broke above its early August local highs of around 2,860-2,865 on Tuesday. Then it reached the new record high of 2,873.23. Investors' sentiment remained pretty bullish following last Wednesday's bounce off support level of 2,800. Will stocks break higher and continue towards 3,000 mark? We may see some more short-term uncertainty along the medium-term resistance level.
Concluding, the broad stock market will likely open virtually flat today. Then we may see more fluctuations close to the resistance level, marked by the late January high. There have been no confirmed negative signals so far.
By Paul Rejczak via Sunshine Profits
More Top Reads From Safehaven.com


