"No warning can save people determined to grow suddenly rich" - Lord Overstone
 |
Gold •738 days | 2,368.70 | +35.30 | +1.51% |
 |
Platinum •15 mins | 1,629.00 | -1.10 | -0.07% |
|
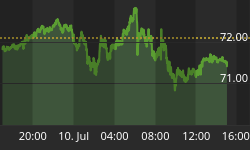
WTI Crude •1 day | 71.41 | -0.67 | -0.93% |
|
Gasoline •1 day | 2.985 | -0.054 | -1.78% |
|
Ethanol •738 days | 2.161 | +0.000 | +0.00% |
|
Silver •738 days | 30.82 | +1.16 | +3.92% |
 |
Silver • 738 days | 30.82 | +1.16 | +3.92% | |
|
Copper • 738 days | 4.530 | +0.111 | +2.51% | |
|
Brent Crude • 1 day | 76.01 | -0.29 | -0.38% | |
|
Natural Gas • 1 day | 2.940 | -0.072 | -2.39% | |
|
Heating Oil • 1 day | 3.553 | -0.018 | -0.51% |
Markets

Market Turning Points
The anticipated short-term peak in prices has now shaved off 30 points from the SPX's 1955 all-time high which occurred on 6/09. Because of the market's current cyclical configuration and…
Winning Streak Ends
The market recovered a bit on Friday after prices ended lower the previous three consecutive days. Bullish results from the tech sector held the market up at week's end but…
We Are So Not Prepared For Another Oil Shock
In one sense, energy doesn't matter all that much to what's coming. Once debt reaches a certain level, oil can be $10 a barrel or $200, and either way we're…
Haven't We Already Done Enough Damage in Iraq?
Because of the government's foolish policy of foreign interventionism, the US is faced with two equally stupid choices: either pour in resources to prop up an Iraqi government that is…
This Week Ahead Should Be a Major Test For Gold
Gold seems to have found support at 1240, where we saw accumulation form, and has been rallying since. Gold closed the week forming a morning star pattern off the bottom…
IBEX: Reassessing The Long Term Elliott Wave Pattern
I maintain the idea that IBEX given the internal structure of the decline from the November 2007 is highly vulnerable of a major setback once the corrective advance from the…
ECB: More To Come?
The ECB (European Central Bank) introduced a huge package of measures to inspire economic growth. EURUSD stays under pressure in the medium term, but could rebound to 1.37 short-term.
This Past Week in Gold
Summary: Long term - on major sell signal since Mar 2012. Short term - on mixed signals. Gold sector cycle - down as of 3/21, ending the up cycle since…
Gold and Mining Stocks' Death Cross
Gold has just experienced a Death Cross, where its declining 50 Day Moving Average has crossed below its declining 200 Day Moving Average.
US Dollar Index Huge Consolidation Pattern
Let's first look at the yearly chart of the US Dollar Index to see what it means ...
Sign up to the
Safehaven Market Insider


