"No warning can save people determined to grow suddenly rich" - Lord Overstone
 |
Gold •739 days | 2,368.70 | +35.30 | +1.51% |
|
Platinum •15 mins | 1,636.40 | +7.40 | +0.45% |
|
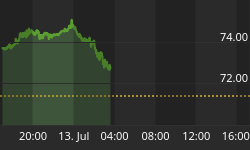
WTI Crude •11 mins | 73.40 | +1.99 | +2.79% |
|
Gasoline •11 mins | 3.061 | +0.077 | +2.57% |
|
Ethanol •739 days | 2.161 | +0.000 | +0.00% |
|
Silver •739 days | 30.82 | +1.16 | +3.92% |
 |
Silver • 739 days | 30.82 | +1.16 | +3.92% | |
|
Copper • 739 days | 4.530 | +0.111 | +2.51% | |
|
Brent Crude • 11 mins | 78.25 | +2.24 | +2.95% | |
|
Natural Gas • 11 mins | 2.896 | -0.044 | -1.50% | |
|
Heating Oil • 11 mins | 3.645 | +0.092 | +2.58% |
Markets

The Birth of a New Bull Market
If I asked you why you think I'm bullish on platinum and palladium, you'd probably point to the strikes in South Africa, the world's largest producer of platinum. Or maybe…
Will Central Banks Need to Buy Gold Back from The Market?
There is a belief that central bank gold in the custody of the world's leading central banks such as the Fed, the Bank of England and the Banque de France…
US OIL Elliott Wave Technical Analysis
Last analysis expected a little upwards movement to the target at 102.14 to 102.61 to last about five days. So far upwards movement has reached 102.99 and has lasted six…
Elliott Wave Analysis: AUDJPY and AUDUSD Intraday
With weak stock market money flows into safe haven currency, the Japanese yen. Yen is up across the board and with more coming on stock markets we think that Yen…
The Bears Flex Their Muscles...
Tuesday saw the bears flex their muscles but they came up short of really dominating the bulls. All three canaries (IWM, KBE, KRE) moved lower but none of them retested…
Rubber, Meet Road
The consolidation continues as the market momentum aligns for a potential move lower as it appears. Let's take a look at what I'm talking about with two of our basic…
The Lazy 1970's vs. the Frenetic 2000's
Many people today see the Fed's Quantitative Easing as money printing. They remember what happened in the 1970's, and they instantly jump to conclusions. However, we live in a different…
EUR/USD: Monitor Resistance at 1.3732
EUR/USD has made a bullish intraday reversal near the key support area between 1.3673 (see also the long-term wedge formation) and 1.3643 (see also the 200 day moving average). However,…
Trade Alert
As confirmed in the daily chart below, LinkedIn Corporation stock (LNKD) started a correction at the beginning of March and the price kept dropping until the start of April. In…
SQQQ: Bullish Setup
In the weekly chart of NDX we can see a potential Head and Shoulder reversal pattern.
Sign up to the
Safehaven Market Insider


