A torrid post-crisis recovery in the NYC housing market came to a screeching halt last year as a chasm opened up between what sellers were asking and what buyers were willing to pay.
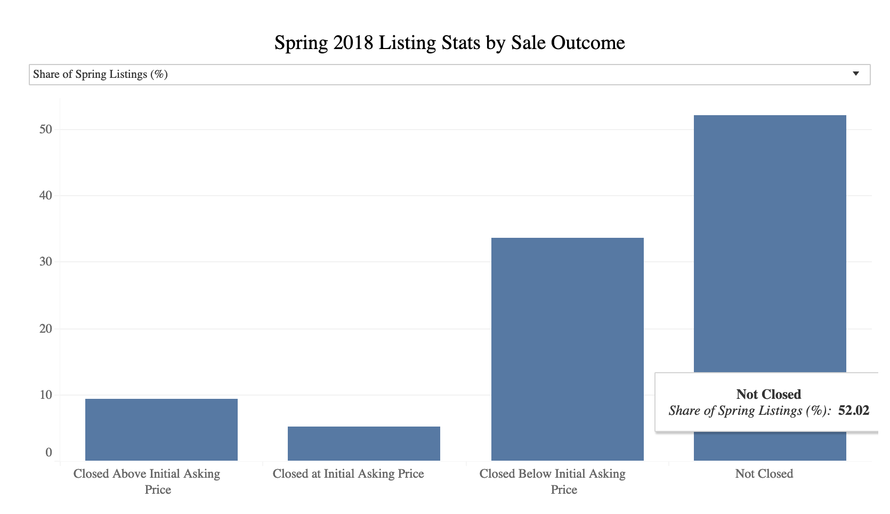
But in the clearest post-mortem showing just how bad last year was for one of the world's most unaffordable real estate markets, Property Shark found in a recent analysis that less than half of the housing inventory available sold last year. According to PS, 48 percent of the homes listed between March through May of last year had been sold as of Feb. 1.
It’s a symptom of New York’s softening market, where a glut of inventory has given buyers major bargaining power, said Grant Long, senior economist for StreetEasy. Of the homes that didn’t sell, only 14 percent are still listed. But most of the homes that were pulled off the market could easily reemerge
And of the homes from last spring that did sell, roughly 70 percent of them closed for less than their owners initially sought. That’s up from 62 percent of sales a year earlier and 61 percent in 2016.
The resulting glut in unsold inventory is creating problems for sellers who are facing another tidal wave of inventory.

(Click to enlarge)
Here's a breakdown of the report's findings (text courtesy of Property Shark):
1. Of All Homes Listed for Sale in Spring 2018, Fewer Than Half Sold
Just 48 percent of the homes listed during March, April, and May 2018 had sold as of February 2019. While weakness at the top of the NYC sales market has been grabbing headlines, the sluggish pace of sales has extended to homes across boroughs and price points. Manhattan homes fared slightly worse than others, with just 44 percent selling, but even in the comparably strong market in Queens, just 54 percent of homes found buyers. This is not only about price: Though 61 percent of all homes listed for $1 million or more failed to sell, so did 45 percent of all homes priced under $1 million. (Nonetheless, units priced at or above $5 million fared far worse, with just 140 of 656 units, or 21 percent, finding buyers.)
The Greenwich Club condominium in the Financial District exemplifies this trend. A total of 31 units in the building were listed for sale in March, April, and May 2018, but only six have sold. One more entered contract in December and another six have since relisted, but many — including a 1-bedroom asking $1.25 million, 25 percent above its 2016 purchase price — left the market without fanfare in late 2018.
2. Many Homes Listed Last Spring Were Taken Off-Market
Most sellers who were unable to find buyers at suitable prices have simply pulled their listings from the market. Of all listings created in spring 2018, 40 percent are either paused, delisted, or otherwise no longer available on StreetEasy. Only 7.5 percent of all the listings from the peak months, or 14 percent of the total unsold units, are still actively seeking buyers. Listing agents marked another 4.5 percent of homes as in-contract, with the majority entering deals in late 2018 and presumably closing in early 2019. Yet with many more unsold, we will likely continue to see heightened inventory heading into the spring home-shopping season, as these sellers try again to find a buyer.
3. The Majority of 2018 Sales Closed Below Asking Price
Of homes listed last spring that managed to find a buyer, we estimate that 70 percent closed below their initial asking price[1]. The median difference between the recorded closing price (as reflected in public records) and the initial listing price on StreetEasy was 5.5 percent, for a $44,000 discount off the $800,000 median listing price for homes sold. Buyers enjoyed particularly high negotiating power in Manhattan, where 77 percent of homes sold below their initial asking price, compared to 68 percent of homes in Queens and 61 percent of homes in Brooklyn. Related: Billion Dollar Bust Proves The World Still Has A Drug Problem
Homes selling below their initial asking price is not a new phenomenon, but with heightened competition for buyer interest, spring 2018 was particularly painful for sellers. In 2017 and 2016, 62 and 61 percent, respectively, of homes listed in the spring sold below ask in a comparable time period.
4. Aggressively Priced Homes Stand Out
Though these numbers make selling a home seem daunting, a significant chunk of homes - 19 percent of all sales - closed above their original asking price. While these home sales ranged across price points and neighborhoods, they tended to be among the cheapest in their respective neighborhoods for their bedroom count. Homes that ultimately sold above ask were initially listed for a median of 8.8 percent below the respective 2018 median price for their neighborhood and bedroom count. Meanwhile, homes that sold below asking price have listed a median of 1.2 percent above the respective median for their neighborhood and bedroom count. Homes that went unsold were initially listed for a median of 6.4 percent above their respective benchmark median.
By Zerohedge.com


