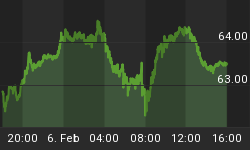
I have been following the action in long bonds, and noting that it hasn't been good as support levels and trend channels have broken down. This can be seen in figure 1, a daily chart of the i-Shares Lehman 20 + year Bond Fund (symbol: TLT).
Figure 1. TLT/ daily
Conversely, the Ultra Short Lehman 20+ Year Treasury (symbol: TBT) is showing a price pattern on the weekly chart that is very attractive suggesting higher yields. The close below and this week's close above a key pivot point is a strong bullish signal. See figure 2 for a weekly chart.
Figure 2. TBT/ weekly
In essence, higher yields are in the immediate future, and this should have negative ramifications for equities and commodities. Trends in gold, crude oil, and yields on the 10 year Treasury are rising and this in aggregate will put pressure on equities. In addition, the overbought and overbullish conditions as we approach resistance may also exert an influence at this juncture.
Looking at a chart of silver (or gold for that matter), common sense would argue that some sort of correction is overdue. See figure 3 for a daily.
Figure 3. SLV/ daily
In a nutshell, the market dynamics appear to be changing. Higher yields will put pressure on equities and commodities. These are the themes worth exploring over the coming weeks.


