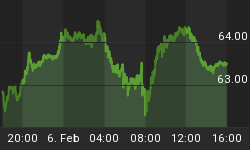
We appear to have a 'rolling top' with broad based weakening analytics and cascading warning signals. This behavior is often seen near major tops. The Friday 01-28-11 sell-off is the initiation of a short term correction and consolidation before we put in a final new high as part of this final topping formation and long term right shoulder construction pattern.
The market action since March 2009 is a bear market counter rally that will end with a classic ending diagonal pattern. The Bear Market which started in 2000 will resume in full force by the spring of 2011.
Highlight examples of weakening analytics and warning signals are as follows:
- Dow Theory non-confirmation between the Dow Industrials and the Trannies
- Inter-market Divergence with new highs in the Blue Chip DOW Industrials with lower closes in the S&P 500, Nasdaq, Russell 2000 and Trannies
- Extreme Bullish Sentiment indicators
- VIX Sell Signal
- Confirmed Hindenberg Omen from December
- Weakening Breadth - 10 DMA A/D Line versus NYSE, NDX and Russell 2000 price.
- Rising Termination Wedge pattern in the Industrials and S&P 500 since the July 2010 lows.
CURRENT MACRO EXPECTATIONS
OUR CURRENT MACRO EXPECTATIONS FOR FINANCIAL EQUITY MARKETS
The following schematic best represents the US S&P 500 Stock Index

SIMPLE GANN ANALYSIS
ELLIOTT WAVE COUNT
CHANNELS ANALYSIS
S&P 500 TARGETS
Near Term Support
We see the near term support to be approximately 1230 on the S&P 500. There is a possibility the sell off may gain momentum and find support at the lower end of the band (see bottom chart) at 1169 but we are skeptical of this because it is unsupported by Gann Analysis.
Intermediate Term Top
Our target for an Intermediate top is 1341 on the S&P 500.
Time Frame
We presently see this Bear Market counter rally which started in March 2009 ending 2011.45.
This approximates June 13th, 2011
Signup for this FREE Monthly Analysis
E-mail: lcmgroupe@comcast.net
Type in the Subject Line: TA Newsletter
Download the complete 39 Page February edition at: February 2011 Market Analytics
I encourage readers to look through the COMMENTARY page of Tipping Points for articles you may have missed. I also encourage you to try our new page for real time TIPPING POINTSnews. We continue to make improvements to the page based on reader feedback


