


Legitimate Fear of Investing Cash Near A Top
On January 16, we presented the chart below, which shows the possible negative impact of holding too much cash during the latter stages of a bull market. Is it rational to keep a big stash of cash on the sidelines after witnessing stock market declines of over 50% in both the 2000-2002 and 2007-2009 bear markets? Yes, it is very rational. However, the Bob-Sally-Dave chart below tells us being too conservative has costs as well. In today's post, we will cover some specific examples of risk-management techniques to balance upside investment potential with downside bear market risks.


Recent Earnings Highlight Need For Risk Management
What eventually kills a bull market? Typically, bear markets begin when earnings begin to drop as the economy begins to contract (a.k.a. a recession). Investors have been reminded recently that stocks need more than the Fed. Friday brought additional reasons for concern. From Bloomberg:
UPS dropped 2 percent as it projected earnings that trailed estimates. Intel Corp. fell 3.4 percent as its revenue forecast raised concern the personal-computer market is struggling to grow. General Electric lost 2.5 percent as margins at its manufacturing units fell short of guidance.
When The Market Does This...
The merits of developing an IF, THEN approach to investing were outlined on October 18. Tracking economic data and observable evidence to monitor stock market risk is one way to greatly reduce the odds of investing cash near a top.
How could have underinvested Sally and Dave captured additional gains between 1997 and 2000 in the graph above? They could have used charts such as the one below, which asks some simple questions about Bollinger Bands. From a probability perspective, the odds of "good things happening" in the stock market are higher when (a) the S&P 500 is above the dotted line, and (b) when the slope of the dotted line is positive. Between 1997 and the peak in 2000, the answers to both questions were "yes" or bullish. From a probability perspective, the "odds of bad things happening" in the stock market increase when the answers to both (a) and (b) are "no", which was the case during the vast majority of the net-worth destroying bear market following the demise of the technology bubble.

In January 2014, the chart above sides with stock market bulls, which aligns with the majority of the hard, binary, and observable evidence.
Earnings Offset By Industrial Activity
One of the strengths of using charts to monitor the aggregate perception of the economy is they give us a reference point to weigh positive economic data against negative economic data. Friday, earnings reports were less than stellar, but a read on the economy was much better. From Reuters:
U.S. industrial output rose at its fastest clip in 3-1/2 years in the fourth quarter as factory activity closed out the year on a strong note, a sign of the economy's brightening prospects.
No Such Thing As A Perfect Indicator
Is using the monthly chart with a Bollinger Band a foolproof way to monitor the markets and manage risk? No it is not. In fact, there is no such thing as a foolproof indicator, chart, or risk-on vs. risk-off ratio. However, there are hundreds of sound methods that can assist us in monitoring risk and consequently improve our odds of investment success. Our market model uses indicator, method, and model redundancy to offset the fact "there is no perfect way to track the markets".
Another Prudent Way To Track Risk
Another way Sally and Dave could have captured more of the gains between 1997 and 2000 was to monitor the slope of the S&P 500's 22-week moving average (shown in blue in chart below). From a probability perspective, the odds of "good things happening" in the stock market are higher when the slope of the 22-week moving average is positive, as it was for the vast majority of the time between 1997 and the stock market peak in 2000. From a probability perspective, the "odds of bad things happening" in the stock market increase when the slope rolls over in a bearish manner, as it did in 2000.

In January 2014, the chart above sides with stock market bulls, which aligns with the majority of the hard, binary, and observable evidence.
System Needs More Than Two Charts
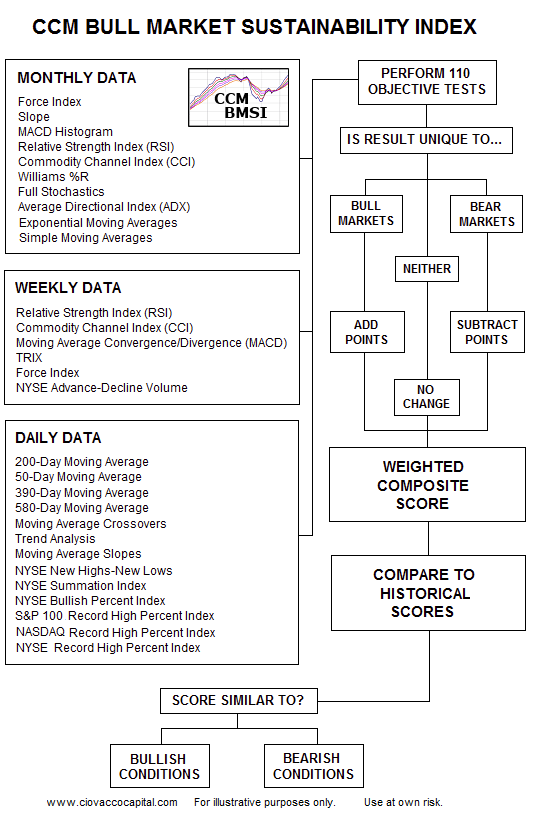
To understand what we mean by indicator redundancy, this flow diagram shows the inputs from one of the submodels that feeds into our master market model; notice how multiple times frames are used as another way to diversify inputs.
Investment Implications - Watching Market Paint Dry
At press time, the S&P 500 was up three points this week and down 3 points for 2014, which means not much has changed in the first 17 calendar days of January. The observable evidence was bullish before corks were popped on New Year's Eve; it is still bullish. The tweet below still applies:

Our best investment advice for 2014 is to stop trying to figure out what is going to happen, and instead focus on what is happening. What is happening is bullish. Consequently, we continue to maintain positions in U.S. stocks (VTI), financials (XLF), technology (QQQ), small caps (IJR), Europe (FEZ), and global stocks (VT).


