


Weekly Trader Alert #83
12/18/2006 8:57:45 AM
Overview
A week ago, we saw wage growth dropping and the services index showed an increase in the strength of the services sector. This effectively countered the fall in contraction in manufacturing activity reported the week before. Last week we saw CPI actually drop to nil for November, dropping the core rate to 2.6% annually. While the Fed has made somewhat hawkish statements, and their comfort zone is to have inflation below 1%, the trend is moving in the right direction. Even unemployment was reported back into a somewhat normal 304K, dropping 20K from the previous week's apparently extraordinary number.
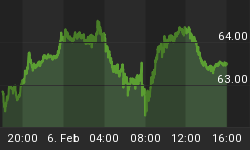
Oil and natural gas closed up $2.40 from a week ago, with oil at a closing price $64.43. Natural gas fell a bit more than one percent to $7.445.
Overall, we see oil trading in a range of $61 to $64 still, but getting to the high side. We also see a continued bullish move in oil stocks, with a lot of investing or trading in these names betting on higher profits for these companies.
We believe that oil remains a wild card in the soft landing scenario. Significantly higher oil prices would now likely cut into consumer spending, will contribute to rising business costs, and will contribute to non-core inflation. We believe if oil moves back above $64 per barrel, it will have an adverse effect on the stock market.
To understand more about our view on the markets, we will have to look at the charts.
Market Climate
The market continues to rise. Thus far, there has been no confirmation of a market top. Even so, it appears that there is a lot of trading interest in the large caps that is causing to markets to move up, even as the greater number of stocks are in decline. This lack of breadth is of some concern in terms of the sustainability of the uptrend.
A chart of the composite of over 8,000 stocks traded on the U.S. Stock markets continues to be included.
The U.S. stock market composite chart:

Price continues to test the upper Bollinger Band, with the 20-day moving average serving as support. Price is caught between these two boundaries. Once again, until you get a break downward, the bullish case is still intact for the US Composite.
Last week we featured a special section called the anatomy of a top. We intend to continue this discussion when the market does something to indicate a top may be in. This week's extension of that subject is on the VIX and the VXN, the implied volatility indexes for the S&P-500 and NASDAQ-100 respectively.
Let's take a look at the daily chart of the VIX (CBOE:VIX):

The VIX shows that a new intraday low was hit on Friday, before the VIX moved back upward through the day as the market sold off. The candlestick pattern on the VIX, however, indicates a continuation to the downside is the most likely move, so a top is not yet confirmed by the VIX for the S&P.
Let's take a look at the daily chart of the VXN (CBOE:VXN):

The VXN is the implied volatility for the NASDAQ. In the timeframe represented by this chart, i.e. a little over two months, the VXN reached a new low on Friday before reversing higher. The candlestick pattern, was a bullish engulfing, which is a reversal signal. This chart could signal a top is near for the NASDAQ. Note that the VXN and the NASDAQ aren't correlated on a day-to-day basis, so even if the VXN did signal a top for the NASDAQ, this could take a bit to emerge on the NASDAQ itself.
For a bit more perspective, we'll also examine the weekly chart of the VXN (CBOE:VXN):

The weekly chart of the VXN shows that Friday's intraday low, which broke down through the 14 level, was actually a low not seen since late in 2005. In fact, the low in 2005 on the VXN was on December 16th, 2005 when it hit an intraday low of 12.85, and a closing low of 13.19. This was followed by a high reached on the QQQQs on Januarly 11th, 2006 of $43.31 intraday and a closing price of $43.21. Note the month lag between the low on the VXN and the high on the QQQQs.
Since implied volatility is calculated from a basket of one month at the money options examining the put/call ratios, it isn't correlated tightly (day-to-day) to NASDAQ-100, but it has good historical accuracy at being generally correlated to tops and bottoms.
From this we see that even if the VIX and VXN began to move sharply upward from here, there could be a lag effect on the actual indexes themselves. We would do best to be aware of the expected reversal they are forecasting, but not to trade on that expectation until we have further indications that a top is in.
Now let's move on with our regular weekly analysis.
A look at the chart for the Dow Industrials is represented by the Diamonds ETF (Amex:DIA).

Abbreviations and color key appears below:
Note the following order is Red, Yellow, Green, just like a stop light, so it might be a helpful mnemonic:
Thick Red line represents the 200-day simple Moving Average, (200DMA)
The yellow line represents the 50-day simple Moving Average, (50DMA)
The green line represents the 20-day simple Moving Average, (20DMA)
The light blue line represents the 3-day Moving Average, moved forward three days in time, (3x3MA)
The thick blue line indicates the exponential 13-day Moving Average (13DMA)
Bollinger Bands are abbreviated as BB. There is an upper and a lower Bollinger Band that varies in distance from a central moving average (shown as light red/pink) based on the volatility of stock price movements.
RSI stands for Relative Strength Index. It is an oscillator, which can be used to determine how overbought or oversold a stock may be.
The DIAmonds broke through the resistance that has been containing them on Thursday. Friday's candlestick pattern indicates caution, but it should be noted that the Dow itself didn't have the same Harami pattern. The chart of the DIAmonds has been affected by the automatic adjustment due to a dividend pending dividend distribution that went ex-dividend on Friday. The Dow shows a true shooting star, which could mark a reversal but must be confirmed. If a reversal isn't confirmed on Monday then it is off to the races once again for the uptrend.
The S&P 500 ETF, known as the Spyders (AMEX:SPY) is shown in the chart below:

The chart for the SPYders broke out on Thursday, the same as for the DIAmonds. Friday's Harami was also created by the SPYders going ex-dividend on Friday. The S&P-500 actually moved up modestly on Friday and the SPYders would have reported a small gain, except for the dividend.
With all that said, the SPYders are in a similar position to the DIAmonds, in that they have a short candle with an overshadow lying just above a long white candle. If this was confirmed by a large move to the downside on Monday, it would be bearish.
Last week, we cautioned we would be careful about shorting the SPYders until a sign of a top is put in. We don't yet have that indication.
This week's NASDAQ 100 ETF (QQQQ) Chart is below:

The QQQQs continue to be the weakest of the major indexes but even the QQQQs are showing signs of breaking out. Thursday's move up to resistance and Friday's move to open above that resistance correlated to the moves made by the market in general. Friday also saw the QQQQs fall back to that level of resistance.
We will have to wait to see what direction the market moves on Monday. The choppiness indicator (not shown) indicated a big move may be starting on Friday. The direction of that move is still ambiguous.
Fundamental Trends
As we stated last week, it's all about Steel and Oil. The difference this week is that the three oil industries moved from fifth through seventh, to second through fourth place. Basic steel remained as a leader but fell to fifth place.
Examining the top screen (top 31 industries) we see only department stores represented in retail, and only shoe makers directly correlated as a supplier to them. In addition to the oil industries in the leaders, the drillers are also in the top screen. Foreign banks and foreign closed end funds are also in the top screen. Could this be a bet on a falling U.S. dollar and/or a belief that foreign equities will do better than their U.S. counterparts in the near future? There are also four building industries in the top screen (heavy construction, cement, wood, and A/C heating products). Even the paper industry is in the top screen. Printing services and Periodicals are also in the top screen, the latter of which is correlated to speculation of a private equity buy-out. Finally, there are two utilities in the top screen as well.
This is quite a mixed bag with cyclical industries (steels and paper), utilities, the oils, and bets on better performance outside the U.S. all being made. Utilities are a classic defensive play which is generally at odds with a belief on continued healthy expansion. This means that many investors aren't comfortable with the markets prospects here.
The Industry leaders (ranked 1st-5th out of 190) are:

Very little has changed among the laggards. Transportation (Services) was replaced by Transportation (Truck) and Plastics made their way to the bottom of the list replacing Home (Textiles). For plastics to be in the laggards is of concern, because of how many oil industries are in the leaders. Plastics depend on oil as a raw component and this suggests that oil may be heading quite a bit higher. That, obviously, has significant ramifications for the broader market.
The other things to note is that coal stocks, while not in the laggards, are still near the bottom. If oil moves up, it will almost certainly cause more interest in coal stocks, as they are an alternative to oil as an energy source for utility companies and the like.
The Industry laggards (ranked 186th-190th out of 190) are:

Trade Recommendations
We are considering two long trades and two short trades.
The long trades are Florida Rock Industries (NYSE:FRK) and Citrix Systems (NASDAQ:CTXS).
The short trades are Ceradyne Inc (NASDAQ:CRDN) and Lehman's Ishares 20-Year Bond (Amex:TLT).
CNE has pulled back and we continue to monitor if for a possible trade entry.
Current Portfolio
FDG closed Friday at $23.98 and continues to trade above resistance. It has found the support of its 50-day moving average. It is approaching resistance at its 100-day moving average at around $25.50. It may be rebuffed initially, but if it breaks through that resistance, then the next level to challenge is the 200-day moving average at around $30.00. strengthen significantly and has broken above resistance, even as the market has been showing signs of a reversal downward. We believe that it should improve further from here.
Generally, our model uses set stop prices to control risk. Index ETFs, including DIA, SPY, QQQQ, and IWM are managed somewhat differently, in that trades will be reversed to time the market, as opposed to using a set stop limit.
Unlike the majority of position trades in the fundamental trader, our ETF trades may see us exit positions prior to specific profit goals being achieved, as we are more concerned with positioning for the correct direction of the market more than with achieving a specific profit level. The reason for this is the profits come over time with a fair number of exchanges for long and short trades.
* Initial stop prices are set to cause us to exit our positions if they close below these levels. You will note they are generally kept pretty tightly the opposite side of the trades we initiate. Historic volatility would imply that intraday price action may trade outside of these values, so that condition is insufficient to cause an exit from an existing position. On significant movement beyond our stop prices, we may issue an intraday message to exit the position or to maintain the position. You may chose to implement an absolute stop below these suggested stop values, but that stop should be wide enough to take care of the daily volatility for the stock in question. You can examine the candlesticks for an idea of intraday price fluctuations.
Entry prices are adjusted to account for dividends paid. The stock price was adjusted by your broker, to reflect the dividend taken out. The non-adjusted entry price reflects the actual entry price, without the adjustment for dividend values.
LVPB Concept: The concept is a Light Volume Pull Back, where a stock's price will pull back to a support level on light volume. Obviously, heavy selling is a sign of weakness, and we would not want to buy on a heavy volume pullback. However, we will occasionally place stocks on the LVPB (Light Volume Pullback List) to indicate a "re-entry" buying opportunity, when we have already entered a position. This should be used to add to existing positions, or to enter a position if you missed the initial entry.
LVPB Portfolio Stocks:
Conclusions
We are going to enter some trades this week, depending on the open on Monday. Look for a follow-up alert with specific instructions for trade entry.
The Markets have been in a relentless move upward for five months now. They also, on Friday, entered the seasonally strong period where a Santa Clause rally leads them upward for a few weeks. We believe that we are getting to the end of this relentless uptrend for a number of reasons, but the seasonal strength should see the uptrend continue. Thus far there has been nothing sufficient to derail the bullish mood, and the market will be looking for a catalyst by early next year.
For those of you who have enjoyed your subscriptions to the Fundamental Trader and who would like to get additional savings off the price of your subscription, you may consider an annual subscription to the service. You can save nearly 20% off of the monthly rate by selecting the annual subscription price. Just click on the link below:
http://www.stockbarometer.com/pagesMFT/learnmore.aspx.
Regards and Good Trading,


