


Weekly Trader Alert #98
4/3/2007 9:35:34 AM
Overview
Friday marked the end of the quarter, leaving the indexes little changed for the year. The Dow is down slightly for the year, while the S&P and NASDAQ are actually up modestly. The Russell-2000 (2000 of the largest small cap stocks) actually shows gains of around three percent year-to-date, flying in the face of those talking heads suggesting that it is time to abandon small cap in favor of the better returns they argue will derived from large cap ownership.
Last week we reported that the market interpreted the Fed's policy statement as indicative of an imminent rate cut. We suggested that investors got it wrong and that the change in language for the Fed policy statement was just that, a change in language. Nothing indicated a rate cut was likely. We also suggested that investors were ignoring the full impact of the sub-prime morass, as twenty percent of loans written in 2006 were sub-prime. We also noted signs of rising inflation that were being ignored. Well, all of this came back to haunt investors this week as it became apparent that they had misinterpreted the Fed's statement.
To understand what transpired in the week to dash hopes of an imminent rate cut, let's review economic reports released during the week.
Monday: The only economic report released Monday was new home sales, which were reported at 848,000 versus an expected 995,000. This miss by 15% isn't the norm as the homebuilders have the opportunity to take down their forecast before the report is compiled and didn't choose to do so. This means that weather should not have been a factor, as the homebuilders can react to weather and take down their forecasts. There have been large downward revisions in these numbers for the last three months. Unsold inventories rose to 8.1 months from a previous high of 7.2 months. Median prices are only 0.3% lower than a year ago, while average prices are 7.5% higher, year over year. This indicates starter homes aren't selling which is linked to the sub prime woes.
Tuesday: Before the market opened, Lennar (a homebuilder) announced a miss on their earnings and removed their 2007 guidance. There was also a speech by a Fed official on the sub prime market, indicating sub prime borrowers would likely struggle for the next two years. On top of this, the Conference Board's consumer confidence number fell short of expectations, falling five points to 107.2, versus an expected 108.5. All three of these things suggest concerns for the economy going forward.
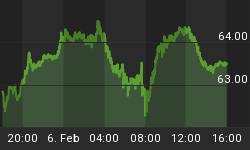
Wednesday: Before the market opened, durable goods orders were reported up 2.5%, which missed the consensus 3.5% increase expected. This actually showed a drop of 1.2% in non-defense spending excluding transportation, which is a proxy for business investment. This followed a drop of 7.4% in January. Fed Chairman Ben Bernanke addressed Congress and essentially confirmed that the market had misinterpreted the Fed's policy statement in their expectation of a Fed rate cut in the near future. Compounding concerns in the sub prime lending space was Beazer Homes (NYSE:BZH). Business Week reported that Beazer is being investigated by several government agencies on various fraud charges. In addition, the price of a barrel of crude oil raised more than a dollar to break out of its trading range and closed at $64.08. This was due primarily to tensions from the situation in Iran, after they took fifteen British sailors prisoner.
Thursday: Thursday's economic reports were positive. Initial jobless claims were reported at 308K versus an expected 320K. While week-to-week volatility is normal for this report, it still is the lowest number of claims reported in two months. The Final GDP number for Q4 was revised upward from 2.2% growth to 2.5% growth. The Chain deflator came in as expected at 1.7%. Additionally, oil rose nearly two dollars to close at $66.03.
Friday: The economic reports were mostly positive with personal income and spending reported at increases of 0.6% versus expectations of a 0.3% increase. Michigan consumer sentiment came in slightly below the consensus estimate of 88.8 at 88.4. Construction spending was reported with an increase of 0.3% versus an expected decrease of 0.6%. Finally, the Chicago Purchasing Managers Index (PMI) was expected to post a 49.5 reading, improving from the last two months reports, but still showing an economic contraction (any report below 50 shows contraction). Instead the report reported 61.7, showing a 14% leap!
Digging further into the regional manufacturing report, the volatile Chicago PMI not only blew out the headline number, it showed new orders leaped from 48.7 in February to 72.2 in March! Production rose from 51.2 to 64.9 in the same period. Employment actually decreased from 50.6 to 45.0 while prices paid dropped from 63.2 to 59.1. Overall, this shows marked improvement in the Chicago region. Monday's national ISM report will show if there is an improvement nationally, or whether manufacturing continues to show contraction overall.
The most important non-headline number on Friday is that inflation rose as expected with the Core PCE deflator rising some 0.3%. Even though this was in-line with expectations, it raises the year-over-year rate to 2.4%, well above the 2% figure the Fed may find acceptable. It virtually rules out a Fed interest rate drop for the time being, validating Fed Chairman Ben Bernanke's comments in front of Congress earlier in the week.
It is worth reviewing the PCE deflator, as it is believed to be the Fed's primary gauge on inflation. Take a look at the graph below (courtesy of Briefing.com).

Note that the level of inflation has now reached a level that has been seldom reached since 1993. Examining the highlighted range, you will note that there were a few occasions where the Core PCE deflator traded in the range where the inflation rate was between 2.4 and 2.6%.
As long as the deflator can reverse from this level, the Fed may not act to raise the Fed Funds rate. It is a virtual certainty that members of the Fed are uncomfortable with the rate at its current level and will act if it moves higher, especially higher than 2.6%, which is the top of the highlighted range. We believe the Fed may act sooner rather than later to curtail a further rise in the Core PCE deflator, if the March deflator moves higher from here. This is because the PCE deflator doesn't take into account the rise in energy and food prices that are quite evident today, and are already squeezing consumers.
As we have stated many time previously, the rise in food prices has about twice the effect on consumers as energy prices, and has been increasing significantly for a year of more, with no sign of letting up. The increase in food prices has, to a large degree, been driven by the use of corn in the manufacture of ethanol in the United States. This raised corn prices, wheat prices (due to the planting of corn rather than wheat), meat products and dairy products (corn is used to feed livestock), etc.
We continue to monitor the Yen dollar exchange rate. In the last week, the Yen strengthened to around 117.50 to the dollar from above 118. On Monday, it weakened once more to close near 118 again. The inflection point where there would likely be a massive unwinding of the carry trade is between 114 and 115.
The weakening of the dollar may be in anticipation of the Chinese selling dollars in reaction to the imposition of tariffs on Chinese goods by the United States. In particular, protectionist sentiment has been on the rise, and this is an instance of it.
Congress passed this legislation due to the fact the paper industry in China is predominantly a government owned/controlled industry. The Chinese government is subsidizing the industry, due to inefficiencies in it. The alternative to the subsidies would be for a spike in unemployment in China as workers were furloughed. Instead, the subsidies are provided and the goods are sold below cost on the world market, thereby hurting the paper industry participants who are not subsidized by their governments.
Where will this protectionist legislation and sentiment lead? We would suggest that free markets are highly efficient. Imposing tariff's on imported goods moves away from free markets and therefore away from efficiency. It would be much better to work out the subsidization of this industry by the Chinese government, and have them focus on improving the efficiencies in their paper industry, or migrate the workers to other jobs. Introducing tariffs will hurt global trade.
Oil gained close to four dollars for the week, closing at $65.87. Natural gas added about thirty seven cents to close at $7.773. This was mainly due to tensions in the Middle East due to Iran's seizing fifteen British sailors during the week and the escalating tensions due to that. You will recall that Iran' continues to defy the United Nations mandate to cease their nuclear enrichment program. Israel, the United States, and the UK are said to be considering all options, including simultaneously attacking Iran's nuclear and military targets in order to defuse the threat.
Market Climate
The last week has seen weakness shown through the week. The latter half of the week has seen an improvement in price, but internals haven't supported any sort of broad advance.
Only small caps are performing in a bullish manner desperately trying to move upward as some investors find the risk reward ratio attractive. With so much concern over rising inflationary numbers, as well as geopolitical concerns over a trade war with China and a possible shooting war with Iran, the markets still haven't fully come to grips with the risk, but are starting to back off a bit from completely ignoring that risk.
Monday's trading did little to change the tone from last week, although equities did move higher, it was on light volume.
The U.S. stock market composite chart:

There is an important divergence of price moving up on lighter volume, while ROC makes a lower high two days ago and then began moving down. This divergence could well results in a failed test of the recent high. We are still convinced that the low that resulted following the Black Tuesday sell-off (February 27th) didn't actually mark the bottom and we will see another challenge before long. With that said, this week could see a continued move to the upside.
Accumulation has continued and reached its highest level in recent times, as shown by On Balance Volume.
We continue to watch semiconductors for leadership up or down. We include the weekly chart below so you can see that we are watching for a break out of the ascending wedge, a break of support, or a break below the intermediate term uptrend channel.

These could lead to a tradable short in the semiconductors and would certainly dictate caution in long positions in these industries. Monday's trading (not shown on the chart) was basically sideways barely breaking the bottom channel uptrend line. We will have to wait to see a full break below the line to consider shorting one of the semiconductor companies.
Fundamental Trends
Four of the five leaders remain, while the fifth (the oil refiners) depart to seventh place. Metal and Glass container makers move into fifth place this week. We continue stocks of Painting Products makers for potential weakness that could make for a good short swing trade.
The Industry leaders (ranked 1st-5th out of 190) are:
Leaders 4-02-2007 | Leaders 3-26-2007 | Leaders 3-19-2007 |
Petroleum (US Integrated) | Steel (Alloy) | Petroleum (US Integrated) |
Petroleum (Mach/Equip) | Petroleum (US Integrated) | Chemical (Fertilizers) |
Building (Painting Products) | Petroleum (Mach/Equip) | Steel (Alloy) |
Steel (Alloy) | Building (Painting Products) | Personal (Funeral Svcs) |
Container (Metal/Glass) | Petroleum (Refining/Mktg) | Food (Dairy Products) |
There was only one change in the laggards last week as Internet Service Providers moved up four places to make room for the photo products industry.
The Industry laggards (ranked 186th-190th out of 190) are:
Laggards 4-02-2007 | Laggards 3-26-2007 | Laggards 3-19-2007 |
Transportation (Airlines) | Internet (Svc Providers) | REIT (Mortgage) |
Retail (Computers) | Retail (Computers) | Retail (Consumer Electronics) |
Leisure (Photo Products) | Transportation (Airlines) | Financial (Mortgage Svcs) |
Financial (Mortgage Svcs) | Financial (Mortgage Svcs) | Building (Resid't/Com'l) |
Building (Resid't/Com'l) | Building (Resid't/Com'l) | Petroleum (Int'l Specialty) |
Trade Recommendations
We are looking for a further slide in the home builders as the market is still due for a bit more of a shake out as well.
We continue to monitor Qualcomm but it hasn't yet rallied to a good entry point. Don't enter this trade until we give specific quidance. We wanted to see a rally to the $43.33 level last week, but it could go all the way up to challenge its previous high, so stay tuned.
We will continue to monitor the homebuilders, but the bottom is not yet in, and we don't want to get in prematurely. We will send out an alert when a bottom seems to have been hammered out. Given Lennar's (a competitor homebuilder) significant earnings miss and take down of their 2007 guidance, this may take awhile, so be patient.
We are now considering a short trade. Stock Option Speculator subscribers bought puts on Qualcomm (NASDAQ:QCOM) last week that already up some 20%. We expect QCOM to rally to around $43.33. A reversal downward from there confirms a short trade.
Current Portfolio
RDY has broken out above resistance and consolidated for a couple of days and looks set to move higher from here.
BPT has moved up nicely and continues to move higher.
Note that both of these trades now have raised stops and we lowered the secondary target for BPT. We are looking for a pull back in oil that should allow us to re-enter BPT on a light volume pull back to around $64.00. If so, we will likely re-enter the trade once again.

FDG sold off with the market last week and is currently sitting on the support of an intermediate term uptrend line.
* Initial stop prices are set to cause us to exit our positions if they close below these levels. You will note they are generally kept pretty tightly the opposite side of the trades we initiate. Historic volatility would imply that intraday price action may trade outside of these values, so that condition is insufficient to cause an exit from an existing position. On significant movement beyond our stop prices, we may issue an intraday message to exit the position or to maintain the position. You may chose to implement an absolute stop below these suggested stop values, but that stop should be wide enough to take care of the daily volatility for the stock in question. You can examine the candlesticks for an idea of intraday price fluctuations.
Entry prices are adjusted to account for dividends paid. The stock price was adjusted by your broker, to reflect the dividend taken out. The non-adjusted entry price reflects the actual entry price, without the adjustment for dividend values.
LVPB Concept: The concept is a Light Volume Pull Back, where a stock's price will pull back to a support level on light volume. Obviously, heavy selling is a sign of weakness, and we would not want to buy on a heavy volume pullback. However, we will occasionally place stocks on the LVPB (Light Volume Pullback List) to indicate a "re-entry" buying opportunity, when we have already entered a position. This should be used to add to existing positions, or to enter a position if you missed the initial entry.
LVPB Portfolio Stocks:
Conclusions
As indicated last week, we have seen a rise in food and energy costs, which are outside of the core rate. With the core rate at a high level, the Fed simply can not lower rates, even if the economy were to weaken further. Friday's Chicago PMI report suggests there are pockets of the economy doing better than expected, so we may actually get the opposite of what the bulls have been forecasting. We may see a strengthening economy in the face of rising inflation. This would force the Fed to raise rates (the bulls want them to lower rates) which would be looked on adversely by the market. However, we are certain the bulls would redefine their reasons for being bullish, once again, as a pick up in the economy will help companies to increase revenues. The question remains whether inflation will reduce consumer spending and company profits sufficiently to warrant a market sell-off.
The markets have corrected a bit from their overly optimistic assessment of a Fed rate cut in the immediate future. They have some work to do to try to break through resistance, or to see another round of selling. We are expecting some consolidation in the immediate future before a larger move. In the short term, this consolidation may be upward toward the short term downtrend lines.
With the Iran crisis seeing oil having spiked to near sixty-six dollars, this has put some pressure on equities. A diplomatic resolution now seems possible, which would see the price of oil ease. At the same time, the price of oil could spike if there is some sort of escalation or a spokesperson in Iran makes another inflammatory statement.
Probably the most important thing to the health of U.S. equities markets right now is liquidity. With the Yen weakening once again to close near $118, the Yen carry trade is alive and well, and that cheap money will be put to work in U.S. markets, supporting a continued move upward.
For those of you who have enjoyed your subscriptions to the Fundamental Trader and who would like to get additional savings off the price of your subscription, you may consider an annual subscription to the service. You can save nearly 20% off of the monthly rate by selecting the annual subscription price. Just click on the link below:
http://www.stockbarometer.com/pagesMFT/learnmore.aspx
Regards and Good Trading,


