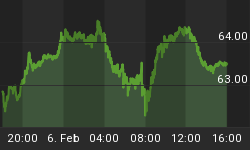
This is just a friendly reminder about how bloody important it is for the HUI-Gold Ratio (HGR) leading indicator (to the precious metals sector) to maintain its higher lows status.
Yesterday the goons apparently attacked 'paper gold' (according to sources who stand on guard for this stuff) after the HGR had become weak. A pleasant thing happened however, as the HGR did not buy the take down in nominal gold. 2 Hour chart above.
Thus the critical higher low to last summer's low remains in place despite a savage day yesterday. Daily chart above.
Which allowed HGR to maintain itself well above the critical 'Armageddon 08' low. Weekly chart above.
Which itself was a higher low to the kickoff of the secular bull market in 2000 (in nominal HUI, not this ratio). Monthly chart above.
The HGR does indeed look lame over the big picture, but as long as the higher lows are in place and as long as macro fundamentals (e.g. the real price of gold) are in place the above is a view of a buying opportunity, as pained as it is to endure for those already all in.
It is a view of opportunity as long as we do not get violations, so you can see why it was a little unsettling when the ratio began to waterfall (by the 2 hour chart at top) into what we now assume was a well coordinated hit (in line with the terrible CoT data noted in this space a couple days ago.
It's all in good fun I suppose. At some point the goons will be behind us, as will this accursed noise about the Fiscal Cliff ™ in which markets are finding the latest emotional obsessions. Indicators like the HGR quietly whir beneath the surface and while it got hairy the other day, it remains unbroken.


