"No warning can save people determined to grow suddenly rich" - Lord Overstone
 |
Gold •732 days | 2,368.70 | +35.30 | +1.51% |
|
Platinum •15 mins | 1,648.00 | +19.90 | +1.22% |
 |
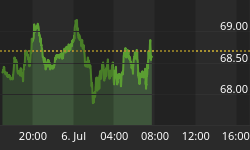
WTI Crude •11 mins | 68.27 | -0.42 | -0.61% |
|
Gasoline •11 mins | 2.957 | +0.040 | +1.37% |
|
Ethanol •732 days | 2.161 | +0.000 | +0.00% |
|
Silver •732 days | 30.82 | +1.16 | +3.92% |
 |
Silver • 732 days | 30.82 | +1.16 | +3.92% | |
|
Copper • 732 days | 4.530 | +0.111 | +2.51% | |
|
Brent Crude • 11 mins | 71.73 | -0.39 | -0.54% | |
|
Natural Gas • 11 mins | 3.231 | +0.035 | +1.10% | |
|
Heating Oil • 11 mins | 3.245 | +0.062 | +1.96% |
Article Archive | Page 736

Gold and Silver Trading Alert: Gold's Inconsequential Rally
Gold Trading Alert originally published on April 6th, 2016 8:06 AM: Gold moved higher yesterday, but it doesn't seem that it had a…
The Janet Yellen Market Rally!
Currently, we are experiencing the SPX topping formation. Again, it is dangerously overextended. The SPX staged a strong rally due to the repeated actions of Central Bankers, during the month…
Elliott Wave Analysis On USDCAD And German DAX
USDCAD USDCAD is not showing clear signs of an impulsive recovery, but it can still be a five wave move, thus a motive wave like a leading diagonal maybe. Currently…
USDJPY Elliottwave Analysis Video April 4
This is a 1 hour Elliottwave analysis video on $USDJPY. Pair is looking to complete wave ((w)) as a zig zag at 110.42 - 110.85, then it should bounce in…
Podcast: The End Of Privacy = Risk Off And Soaring Gold
Between the "Panama papers" and the DC Madam's customer list, we might be witnessing the end of personal (and corporate and government) privacy. The result? Less financial and geopolitical risk-taking…
Oil Trading Alert: Crude Oil - One-Day Rally or Something More
Oil Trading Alert originally published on Apr 6, 2016 6:02 AM Trading position (short-term; our opinion): No positions are justified from the risk/reward…
Forex Trading Alert: EUR/USD - Time for Correction?
Forex Trading Alert originally published on Apr 5, 2016, 4:25 AM Earlier today, official data showed that German factory orders dropped by 1.2%…
EUR/GBP - Ready To Set Two Year-Highs
EUR/GBP has broken the uptrend channel and is now lying around 0.8000. Hourly support lies at 0.7830 (29/03/2016 low). Stronger support can be found at 0.7525 (22/01/2016 low). The technical…
GDPNow Forecast Sinks to 0.4% Following More Weak Economic Report
Following another set of weak economic reports, the Atlanta Fed GDPNow Model for first quarter US GDP sank 0.3 percentage points to 0.4%. Latest forecast: 0.4 percent…
21-Week Cycle High
An examination of all US Presidential election years shows a peak in equity markets in early April followed by a drop into early June. The June low serves as a…


