


The good news is:
• The secondaries held up better than the blue chips in last weeks decline.
Short Term
The secondaries lead both up and down.
Although all of the major indices declined last week the S&P 500 (SPX) was down 1.81% while the Russell 2000 (R2K) was down only 0.78%.
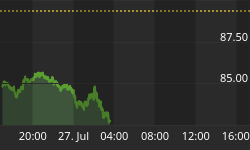
The chart below covers this year showing the R2K in red and the SPX in green a FastTrack (www.fasttrack.net) relative strength indicator called Accutrack is shown as a histogram on the bottom. Accutrack hit its low a few days ahead of the January price low and last week rose while prices were declining. Although not as extreme as the January example the pattern last week was similar.

Intermediate Term
It is encouraging that volume did not increase during last weeks decline.
The chart below covers the past year showing the SPX in red and a 5% trend (39 day EMA) of NYSE total volume in black. Dashed vertical lines have been drawn on the 1st trading day of each month; the vertical line is red on the 1st trading day of the year. The indicator hit an all time high last August, a 3 year low in October and is again near its 3 year low. Hopefully, volume will pickup on the next rally.

Seasonality
Next week includes the 5 trading days prior to the 3rd Friday in May during the 4th year of the Presidential Cycle.
The tables show the daily return on a percentage basis for the 5 trading days prior to the 3rd Friday in May during the 4th year of the Presidential Cycle. NASDAQ (OTC) data covers the period from 1963 - 2007 and SPX data from 1953 - 2007. There are summaries for both the 4th year of the Presidential Cycle and all years combined. Prior to 1953 the market traded 6 days a week so that data has been ignored.
By most measures the returns for the coming week have been modestly negative.
Report for the week before the 3rd Friday of May
The number following the year is the position in the presidential cycle.
Daily returns from Monday through 3rd Friday.
| OTC Presidential Year 4 | ||||||
| Year | Mon | Tue | Wed | Thur | Fri | Totals |
| 1964-4 | 0.13% | -0.28% | 0.25% | -0.40% | -0.38% | -0.68% |
| 1968-4 | 0.67% | -0.38% | -0.53% | -0.07% | -0.30% | -0.62% |
| 1972-4 | 0.70% | 0.02% | -0.46% | 0.82% | 1.02% | 2.09% |
| 1976-4 | -0.32% | 0.04% | -0.31% | 0.31% | -0.16% | -0.43% |
| 1980-4 | -0.07% | 0.80% | 1.08% | 0.66% | 0.42% | 2.89% |
| 1984-4 | -0.68% | 0.05% | -0.13% | -1.03% | -0.61% | -2.40% |
| Avg | 0.06% | 0.11% | -0.07% | 0.14% | 0.07% | 0.31% |
| 1988-4 | 0.23% | -0.29% | -1.42% | -0.20% | -0.06% | -1.74% |
| 1992-4 | 0.23% | -0.54% | -0.27% | -1.02% | -0.35% | -1.95% |
| 1996-4 | 1.59% | 1.03% | -0.07% | 0.46% | 0.21% | 3.22% |
| 2000-4 | 2.23% | 3.05% | -1.95% | -2.92% | -4.19% | -3.79% |
| 2004-4 | -1.45% | 1.13% | 0.02% | -0.08% | 0.82% | 0.43% |
| Avg | 0.57% | 0.88% | -0.74% | -0.75% | -0.72% | -0.76% |
| OTC summary for Presidential Year 4 1964 - 2007 | ||||||
| Avg | 0.30% | 0.42% | -0.34% | -0.32% | -0.33% | -0.27% |
| Win% | 64% | 64% | 27% | 36% | 36% | 36% |
| OTC summary for all years 1963 - 2007 | ||||||
| Avg | -0.05% | 0.06% | 0.11% | 0.03% | -0.24% | -0.08% |
| Win% | 47% | 47% | 60% | 51% | 43% | 49% |
| SPX Presidential Year 4 | ||||||
| Mon | Tue | Wed | Thur | Fri | Totals | |
| 1956-4 | -0.55% | -1.05% | -0.69% | 1.22% | -0.47% | -1.54% |
| 1960-4 | -0.09% | 0.38% | -0.04% | 0.43% | 0.27% | 0.96% |
| 1964-4 | -0.12% | 0.32% | -0.23% | -0.14% | 0.30% | 0.12% |
| 1968-4 | -0.31% | -0.07% | -0.05% | -0.48% | -0.72% | -1.63% |
| 1972-4 | 0.45% | -0.19% | 0.22% | 0.98% | 0.96% | 2.43% |
| 1976-4 | -0.25% | 0.17% | -0.08% | 0.81% | -0.73% | -0.07% |
| 1980-4 | 0.06% | 1.45% | 0.52% | 0.13% | 0.34% | 2.49% |
| 1984-4 | -0.62% | 0.32% | -0.01% | -0.90% | -0.51% | -1.72% |
| Avg | -0.14% | 0.34% | 0.12% | 0.11% | -0.13% | 0.30% |
| 1988-4 | 0.75% | -1.28% | -1.58% | 0.49% | 0.18% | -1.45% |
| 1992-4 | 0.59% | -0.53% | 0.04% | -0.79% | -0.74% | -1.43% |
| 1996-4 | 1.44% | 0.62% | -0.03% | -0.09% | 0.61% | 2.56% |
| 2000-4 | 2.21% | 0.94% | -1.24% | -0.73% | -2.10% | -0.93% |
| 2004-4 | -1.06% | 0.68% | -0.26% | 0.05% | 0.40% | -0.19% |
| Avg | 0.79% | 0.09% | -0.61% | -0.22% | -0.33% | -0.29% |
| SPX summary for Presidential Year 4 1956 - 2004 | ||||||
| Avg | 0.19% | 0.14% | -0.26% | 0.08% | -0.17% | -0.03% |
| Win% | 46% | 62% | 23% | 54% | 54% | 38% |
| SPX summary for all years 1953 - 2007 | ||||||
| Avg | -0.01% | 0.10% | 0.10% | -0.01% | -0.13% | 0.05% |
| Win% | 50% | 56% | 51% | 51% | 49% | 51% |
Conclusion
Although it could change Monday, there are no indications that the current decline has played out and seasonally next week has been modestly negative.
I expect the major indices to be lower on Friday May 16 than they were on Friday May 9.
This report is free to anyone who wants it, so please tell your friends. They can sign up at: http://alphaim.net/signup.html. If it is not for you, reply with REMOVE in the subject line.
Gordon Harms produces a Power Point for our local timing group meetings. You can get a copy of that at: http://www.stockmarket-ta.com/.


