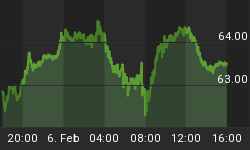
Along with the ratios for gold-silver, gold-industrial metals, gold commodity complex and of course Dow-gold, we keep an eye on the all important gold-oil ratio (GOR). A look at a monthly chart shows that the GOR is now down in the area near the ridiculous 2005 bottom. It has been a tough haul for GOR during this latest manic run in oil but this daily chart begs you to listen to its message; a bottom appears to be getting hammered out, and that is very important obviously to the gold miners' margins.
I often write about the 'dreaded commodity bulls' probably to the detriment of my readership levels since insulting a good chunk of your readership is generally not the way to go for successful market commentary. But it is what it is and while the minority view thesis presented here over the last couple years has been battered, it is not beaten. I want... no NEED oil down and gold to take the sympathetic correction it is currently getting for the thesis to pan out. Let me be clear; this is the Hoye thesis that I picked up on several years ago and it made such sense to me that it has become a part of the way I look at the markets. Gold is different, but in Bob Hoye's view, most gold bugs are clueless as to why gold is not like oil, copper, tin, uranium, natty gas, hogs, wheat and even silver.
What we are experiencing right now is a monetary crisis and it is global. The Bear Sterns blow up was a nice exclamation point to the first phase of the meltdown. Now Wall Street and the financial services industry get a respite during which they may repair the collective psyche to some degree (and sell a few investment products), but the ratio of gold to various other asset classes will signal the coming of the next down phase. Here is the GOR looking to bottom. I would advise sober people to also watch the gold-silver ratio every day. I expect I'll be posting that one shortly, when something notable shows signs of getting in motion. For now, the GOR chart is self-explanatory.
Have a great weekend.


