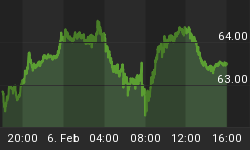
The US Dollar:
The US dollar had a big rally from July until just a few weeks ago as the dollar started an avalanche slide putting in a small dead cat bounce last week. Friday the USD closed on a 3 day low and from looking at the daily chart the beginning of another downward slide should push gold prices higher in the near future. The technical's for the US dollar look bearish with the 50 day moving average starting lower, momentum shows divergence indicating lower prices, and stochastic is showing the US dollar topping here for this bounce.
US Dollar Daily Chart
Spot Gold Price (GLD ETF) Trading Signals:
Spot Gold (GLD) moved higher on Friday by 2.56% and it looks like its trying to make a new short term high. We have seen similar price action back in Sept and Oct this year only to see prices drop quickly after a new short term high was put in place. We did have a setup last Thursday at the close to take another long position, but because our support trend line would be much steeper than 45 degrees, a move higher will most likely be followed by a sharp correction. If we do get a correction I think it should bring us back down to our current trend line with any luck.
GLD is the best way to trade gold because anyone who can trade stocks can trade this gold ETF. Also we can trade it in our 401k, RRSP's and other retirement accounts. Currently we are long gold from $74.52 and looking to add to our position when the time is right and risk is under 3% for the next entry point.
Gold Trading Signal - GLD ETF Trading
Gold Stocks / Gold Equities
The Gold Bugs Index is a great indicator and generally I find it leads the price of gold for up to 4 days on the daily chart. The daily HUI chart (gold Stocks) are something I pay close attention to, simply because gold stocks generally out perform the price of gold in rallies and vice-versa for corrections. As you can see in the chart below, the gold bugs index has made a counter trend rally as it climbs toward the 50 day moving average and also putting in a small 5 wave pattern which can indicate that a short term top is near.
I do think we could see prices move a higher in the next week or so, I think we are ever extended and selling will pull things back down.
Gold Stocks / Gold Equities - Daily Trading Signal
Gold and US Dollar Summary:
The US dollar looks to be headed lower and gold looks a little like it could be putting in a short term top here. This is when most traders start to get confused as some indicators will give a cross signal leaving you wondering what the heck to do next. When things get confusing I always step back, look at some longer term time frames like the weekly and monthly charts for gold and the HUI. Once my head is clear again on the direction of the market I look for my setups and enter when risk is less than 3%. While the markets are always some what confusing, it is important to stick with your trading strategy instead of rolling the dice and tossing your hard earned money into the market hoping it will move in your direction.
The one thing all new or learning traders must know is that NO ONE EVERY KNOWS WHAT THE MARKET IS GOING TO DO NEXT. It may look like some traders know, but really we don't. Successful traders wait for the trade to come to them and when the odds are on our side will we take a position with a low risk setup. If a play goes against us (more than 3% against me), we exit quickly using a stop order and wait for the next setup. Managing your losses IS what trading is all about and that's the area most traders go wrong. I do miss a lot of good trades each year because risk is over 3% on most setups, but I do not want to make a lot of trades. I just want to have a few good trades.
If you have any questions you can contact me at: Email: Chris@TheGoldAndOilGuy.com.


