• 681 days Will The ECB Continue To Hike Rates?
  • 681 days Forbes: Aramco Remains Largest Company In The Middle East
  • 683 days Caltech Scientists Succesfully Beam Back Solar Power From Space
  • 1,083 days Could Crypto Overtake Traditional Investment?
  • 1,087 days Americans Still Quitting Jobs At Record Pace
  • 1,089 days FinTech Startups Tapping VC Money for ‘Immigrant Banking’
  • 1,092 days Is The Dollar Too Strong?
  • 1,093 days Big Tech Disappoints Investors on Earnings Calls
  • 1,094 days Fear And Celebration On Twitter as Musk Takes The Reins
  • 1,095 days China Is Quietly Trying To Distance Itself From Russia
  • 1,096 days Tech and Internet Giants’ Earnings In Focus After Netflix’s Stinker
  • 1,099 days Crypto Investors Won Big In 2021
  • 1,100 days The ‘Metaverse’ Economy Could be Worth $13 Trillion By 2030
  • 1,100 days Food Prices Are Skyrocketing As Putin’s War Persists
  • 1,103 days Pentagon Resignations Illustrate Our ‘Commercial’ Defense Dilemma
  • 1,103 days US Banks Shrug off Nearly $15 Billion In Russian Write-Offs
  • 1,106 days Cannabis Stocks in Holding Pattern Despite Positive Momentum
  • 1,107 days Is Musk A Bastion Of Free Speech Or Will His Absolutist Stance Backfire?
  • 1,107 days Two ETFs That Could Hedge Against Extreme Market Volatility
  • 1,109 days Are NFTs About To Take Over Gaming?
  1. Home
  2. Markets
  3. Other

Investor Sentiment: Sell Into Strength

This is the third week in a row where the "dumb money" is neutral and the "smart money" is bearish, and this is not a scenario that is generally supportive of higher prices especially with prices on the S&P500 under their 40 week moving average. The ideal situation for higher equity prices would be for the "smart money" to be bullish and the "dumb money" bearish (i.e., bull signal).

The "dumb money" or investment sentiment composite indicator (see figure 1, a weekly chart of the S&P500) looks for extremes in the data from 4 different groups of investors who historically have been wrong on the market: 1) Investor Intelligence; 2) Market Vane; 3) American Association of Individual Investors; and 4) the put call ratio.

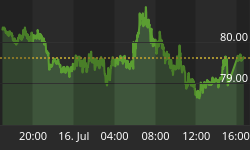
Figure 1. "Dumb Money"

When combining the "dumb money" indicator with other metrics such as poor market internals and price under the 200 day moving average, we find that rallies tend to fail after 4 weeks of the "dumb money" indicator being neutral. Therefore, I would be a seller into rallies as the current set of conditions is more consistent with intermediate term topping action. In essence, we need to ask ourselves: what is going to propel prices higher? With sentiment no longer bearish (i.e., bull signal) and market internals lackluster, this bear market rally, which started in mid November, remains suspect.


Back to homepage

Leave a comment

Leave a comment