


After five weeks of "straight up" price action, the major indices and their ETF proxies are approaching key resistance levels.
Please review the methodology and the significance of the key price levels by clicking on this link.
A weekly cart of the S&P Depository Receipts (symbol: SPY) is shown in figure 1. The weekly close over the most immediate pivot low point at 82.61 will likely propel prices to the next key pivot at 86.78. This is about 1 point away from this past Thursday's close. The pivot at 86.78 represents significant resistance formed not only by the pivot but also by the down sloping trend line and the positive divergence bar (i.e., price bars marked in red). This level served as support for over 4 weeks back in December, 2008 and it was tested as resistance for four weeks in January, 2009 before breaking down in February. The market is currently over bought and investors are becoming increasingly bullish as prices approach this key level. Therefore, I have a hard time seeing the SPY breaking through these levels very easily. Over the next couple of weeks, I am anticipating selling pressure to resume here. If I am wrong, there will be a breakout, which should propel prices to the 40 week moving average.
Figure 1. SPY/ weekly
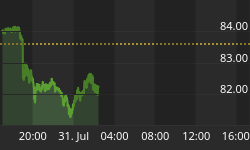
A weekly chart of the Diamond Trusts (symbol: DIA) is shown in figure 2. There is significant resistance at 82.61, which is less than 3% from current prices. This resistance level represents the prior break down point, and once again, within the context of the current sentiment and breadth picture, I am expecting selling and the market to stall at these levels. A breakout above the down sloping trend line would propel prices to the 40 week moving average.
Figure 2. DIA/ weekly
Figure 3 is a weekly chart of the Power Shares QQQ Trust (symbol: QQQQ). When I last wrote about the QQQQ on March 24 I stated: "The QQQQ is our best performer as prices have catapulted outside the upper channel line. A weekly close over the two upper pivots (at 30.33) would be considered a "breakout" in my book. The last "breakout" in early February was a fake out, but if this one "sticks", expect a melt up to $35 at the 40 week moving average."
I would say that we are on target for this to happen. 30.33 is now support, and I would expect selling pressure at the down sloping 40 week moving average.
Figure 3. QQQQ/ weekly
Figure 4 is a weekly chart of the i-Shares Russell 2000 Index (symbol: IWM). The close above the pivot at 42.38 will likely propel prices to the 47.58 level, which is about 1 point away from the recent close. There is significant resistance in this region - a key pivot point and 2 positive divergence bars. Like the SPY and DIA, I would expect selling. A weekly close above these levels would be significant and likely propel prices to the 40 week moving average.
Figure 4. IWM/ weekly
The over riding theme seems to be that key resistance levels are being approached just as investors are becoming more bullish and as the market is overbought. Overbought can always become more overbought and as we all know, it takes bulls to make a bull market. But within the context of the current bear market, I don't think this will happen just yet. I could be wrong. Nonetheless, I believe the market will require more time and will have to regroup at lower levels before successfully breaking through these resistance areas for good. If wrong, we will know, and we should expect prices to bolt to their 40 week moving averages.


