


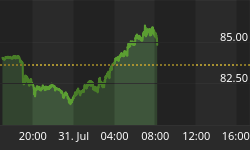


Figure 1 is a daily chart of the S&P500 with the amount of assets in the Rydex Money Market Fund in the lower panel.
Figure 1. S&P500 v. Rydex Money Market/ daily
Figure 2 is a daily chart of the S&P500 with the amount of assets in the Rydex bullish and leveraged funds versus the amount of assets in the leveraged and bearish funds.
Figure 2. Rydex Bullish and Leveraged v. Bearish and Leveraged/ daily
At first blush when looking at these two graphs, you would have to say that the bearish and leveraged Rydex market timer is betting to an extreme degree as the red line is greater than the green line in figure 2. Why would someone assume it is extreme? Because the amount of assets in the Rydex Money Market Fund is extremely low.
However, my interpretation is that this represents a mixed short term sentiment picture. The assets in the leveraged bear funds are greater than the leveraged bull funds and this is bullish. But truth be told, the ratio is not too extreme. On the other hand, the amount of assets in the Rydex Money Market Fund is low and for the past several months, this has been bearish as this is a sign of greed. Typically, one does not see this combination of bearish and leveraged greater than bullish and leveraged associated with low levels of assets in the money market fund. I guess one can surmise that the bears are getting greedy. But that isn't how it normally works. Assets in the money market are usually higher and rising (as a sign of fear) when the bearish and leveraged assets are greater than the bullish and leveraged assets.
However, looking a little more closely at the data from Wednesday to Thursday, we note that about $200 million dollars came out of the Rydex Money Market Fund and close to $200 million dollars went in to the Rydex bearish and leveraged assets. So yes, the Rydex bearish and leveraged assets are high relative to the bullish and leveraged and the assets in the Rydex Money Market Funds are low, and if appears those assets came out of the money market fund to make a bearish bet. The bulls haven't given up yet.
In sum, my interpretation of these two extremes is that it represents a mixed picture, and this is not the norm.
Lastly, I want to thank Johnny G. who has been nice enough to post some his findings and interpretation of the Rydex asset data in the comment sections of the blog. Great work!


