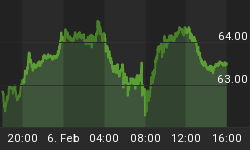
Overall this week has not been that exciting. Volume is below average as the big money traders slowly get back into action and wait for Fridays economic data to come out.
We have seen gold, silver and oil put in a nice rally this week but they are still not in the clear. If we get flat or better unemployment numbers we should see the US dollar rally. This seems to be exactly what the chart is telling us when using technical analysis. Here are the numbers for Friday.
Friday unemployment numbers come out for both the US & Canada.
7:00 AM ET - Canadian Unemployment Rate, Forecast 8.5%, Previous 8.5%
8:30 AM ET - USD Nonfarm Payrolls, Forecast 0%, Previous -11K
8:30 AM ET - USD Unemployment Rate, Forecast 10.1%, Previous 10%
Here is a table I created for understanding what economic data moves stocks, bonds, US$ and gold: http://www.thegoldandoilguy.com/Economic-Indicators.pdf
US Dollar Daily Trend
The current trend of the dollar is now up when looking at the daily chart (higher highs and lows). The strong price thrust in December has formed a nice flag pattern. This is a continuation pattern meaning the dollar should continue higher once this pause is complete.

Gold Futures Trading Trend - 60 Minute Candle Chart
As you can see from the chart below gold has made a short term bottom and is trading at a major resistance level. The question is, does gold reverse and head sharply lower or does it break through the resistance level?
Could this be the start of a new leg higher or a C wave lower (ABC retrace)?
I hope it is an ABC retrace which is a bullish price pattern and it flushes out the weak positions before heading higher.
These are questions no one knows for sure but understanding where the current price is trading and that volatility could pick up very quickly in the next couple days is crucial. When volatility is about to increase managing your open positions or adjusting any possible new trades is an important part of being a successful trader.
Rule #1 Keep overall risk per trade low
If volatility is about to increase I usually trade smaller positions unless I am in the zone and feeling the markets each and every move.
Rule #2 Never let a winning trade turn into a loser
I scale out of positions a little quicker during volatile times to lock in a small profit (20-30% of position) which minimizes my overall risk. This also alleviates some stress as you now have a small profit and you feel good mentally.

Crude Oil - Daily Trend Trading Chart
Many of us have had a great run with oil. Some of us traded the USO fund which is equivalent to buying oil at $71. Volatility was high during the time of the trade so we scaled out of the position at $75, $77.50 and $80. Some of you still have a small core position still in place which is fantastic to see!
Currently oil looks long in the teeth and ready for a pullback which could end up working perfect with Friday's Economic news. Only time will tell so lets take it one candle at a time.

Commodity Trend Trading Conclusion:
In short, this is the first week of the year with light volume as traders get back in the groove and wait for 2010's first big economic news to hit the wires. No many of us want to stick their necks out just yet.
I don't know what will happen but my thoughts are the news will be positive, even if its not. Some very well educated individuals think the unemployment numbers are false giving everyone the impression things are getting better. I don't really know what to think, but I did just see Mr. Moores most recent file on Tuesday and I think it is very possible the US is pulling a long con on Americans. All I can say is thank god I'm Canadian Eh! lol
Anyways ifthe numbers are positive we will see money move into the US dollar, gold and oil will reverse back down. Stocks I think are decoupling from the inverse relationship with the dollar and if that is the case stocks should do well.
Trading before big news can be deadly so I continue wait until Friday or next week before doing much.
If you would like these trading reports delivered to your inbox checkout my website: www.TheGoldAndOilGuy.com


