


The commodity futures charts and gold precious metal stocks have be trading with increased volatility as they bounce between support and resistance levels on the daily and hourly charts.
This report is focused more on technical analysis and charts so that I can show you what I feel these commodities are lining up to do.
GDX ETF - Daily Trading Chart
I posted this chart Monday afternoon to members as a short educational piece and to give warning to those where were currently in short term long positions. This chart clearly shows that when the short term trend is up and we get a black candle (Pop & Drop) the odds tell us that we should see lower prices over the next 24 - 48 hours for silver and gold.
This type of price action may look easy to trade, which it is, but only day traders and even better yet futures traders, can make the most when these setups occur. It doesn't get anymore exciting than Trading after hours with commodity futures.
The nice thing about trading futures is that charts run around the clock 24 hours a day so you do not get price gaps that miss most of the short term low risk plays. Investment vehicles on the NYSE are limited to trading from 9:30am - 4pm and that really does cut down in the amount of low risk trade setups we get on a monthly basis.

Silver Commodity Trading Contract YI - Daily Chart
Silver has been tougher to trade than gold recently. Percentage moves are much larger with silver adding more potential risk to buyers and sellers. In addition, silver is not trending strongly like its big sister gold and this adds another level of difficulty. Profits should be taken quickly during this type of price action.

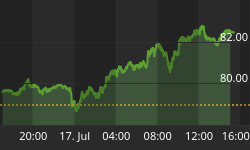
Gold Futures Trading YG Contract - Hourly Chart
Gold is my favorite and most profitable investment vehicle. I trade gold using the GLD etf and futures. Last week I wrote about this key resistance level and how I was waiting to trade until the Friday unemployment numbers were out and to see how the market reacted before putting our money to work. Over the weekend the bullish sentiment caused gold to gap above that key resistance level but has sold back down after beginning the new week.
The chart below shows that I am neutral/bearish for the next few days. Heavy selling and the small bear flag is warning me of lower prices. The natural tendency for gold is to drift higher through the night from 6pm EST - 4am EST, so we could see higher prices in the short term but what happens in the following 1-3 days will set the tone for gold.

Crude Oil Futures Trading CL - Daily Chart
Oil has pulled back the past few days and is now trading near a support level. I feel it is over sold and could bounce the second half of this week and I will keep my eye on it for members.

Natural Gas Futures Trading NG - Daily Chart
Nat gas is the most deadly commodity I know for the uneducated trader. The price swings are wild and WILL trigger you stops no matter where you put them almost. The whipsaw action always seems to form a Mega Phone pattern which means there are higher highs and lower lows during key pivot points forcing shorts to keep coving their positions and longs to keep getting stopped out as they try to protect their down side risk.
I rarely trade Natural Gas because of this. The stats I've heard are that almost everyone who actively trades natural gas will lose their money within 3 months. Yikes! So this is why I am so picky trading it.
The current price of NG is trading in the middle of is range. Entering a trade here is 50/50 and just not worth the risk.

Commodity Futures Trading Conclusion:
There are not too many exciting things in the market right now. We continue to watch stocks and commodities work through their patterns and cycles as we just jump in and out of the market when the timing is right. It's like a large game of double Dutch skipping, just have to time the monitor the patterns, speed and cycles so you lower the odds of getting hit.
If you would like to receive my Free Weekly Trading Reports, please visit my website.


