


This is the first in a 3 part series of a technical and fundamental look at gold and gold mining shares. In part I, I will discuss the price structure and reasons why the gold trade worked for the past year. Parts II and III, which will be presented later this week, are on some of the fundamental drivers that may propel gold and gold shares to higher or lower prices.
I am neither bullish nor bearish. I am not long or short gold mining shares. I can give you my position now and save you the trouble of reading the rest of the articles and this is as follows:
1) technically gold and gold mining shares are oversold and have bounced off support
2) in the absence of fundamental drivers such as inflation or a sinking dollar, I cannot see gold or gold shares moving higher.
Period. You read it. Now let's look at the data, and how I came to these conclusions.
Technical Picture
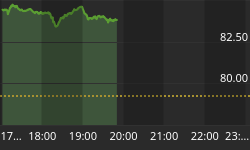
Figure #1 is a weekly chart of the $XAU, the Philadelphia Gold Mining Index. Using the concept of Price Structure Analysis (which I developed; see the very end for further explanation), support in the $XAU comes in at $80.10. This also corresponds with the %50 retracement level of the entire move from the October, 2001 low to the December, 2004 high (trend line AB). The $XAU came down to this level 3 weeks ago and now is enjoying a nice bounce.
Figure #1/ $XAU (weekly)
Figure #2 is also a weekly chart of the $XAU, but the indicators on this chart are not depicting the price action. The chart actually is made up of the 15 largest capitalized stocks in the gold universe. The indicators are meant to show the "internals" of the gold stock sector.
The 1st indicator in panel 2 is an advance decline line (smoothed over 10 bars) of these 15 stocks. I have highlighted with blue ovals the position of the advance decline line when the best moves in gold shares commenced. The advance decline is still headed lower, and we are not at a point where you would expect a big move.
The 2nd indicator, shown in panel 3, is the McClellan Oscillator of the weekly advancing - declining gold issues. First, you can see how strong the sell off in gold shares has been (label #1). Second, the McClellan Oscillator (of advancing-declining issues) tends to lead the price action in that upward breaks in the trend lines of the oscillator occur about a week before prices move higher (blue up arrows). We are not there yet as well.
Figure #2/ $XAU (weekly)/ gold sector internals
The 3rd indicator, shown in panel 4, is the number of stocks trading above their 40 week (or 200 day) moving average, and as you can see, this still has quite a ways to go before reaching true oversold levels. Or put another way, a good base has not been formed from which to launch higher as the both the 10 bar and 25 bar average of this indicator are heading downward.
Ok, that is the weekly look at the gold mining sectors. Now for a daily look at the "internals" of the gold sector refer to figure #3 (next page). Figure #3 is constructed similarly to figure #2 where the hidden data is the 15 largest gold mining stocks but in this case, daily data is used.
Figure#3/ $XAU (daily)/ gold sector internals
The first indicator, shown in panel 2, is the McClellan Oscillator of these 15 advancing - declining issues. Currently, this is in an overbought position.
The 2nd indicator is a composite relative strength line of all 15 of these stocks. This indicator confirms the down trend in the $XAU. The indicator is below 1, and it has not even broken above a down sloping trend line. The trend is still down and the bottoming process has not even begun.
The 3rd indicator is the number of stocks trading below their 40 day moving average, and as you can see, this indicates a very oversold gold mining sector (at least when looking at the daily data). Interestingly, the current level of "oversoldness" from this indicator generally was a good entry point during the recent run in gold shares. The difference here, however, is that the trend is down not up.
The bottom line when looking at the price action in gold mining shares is this:
1) the trend is down
2) bounced off support as defined by the Price Structure Analysis and by the 50% retracement level
3) gold mining shares need to form better base (consolidation period) before moving higher.
Fundamental Picture
Looking at the technical picture is just one part of the equation. The real question is: "what are the fundamental drivers that will propel prices higher in the gold mining sector? Will it be inflation? A weaker dollar?" To understand what these factors might be, let's look at why the gold trade worked over the past year and half.
Figure #4 shows the 10 week moving averages of the SPY, the exchange traded fund proxy of the S&P500 (blue line), and the $XAU, the Philadelphia Gold Mining Index (gold line). The orange vertical bars are meant to highlight key turning points. As you can see and for the most part, when the S&P500 was headed higher, gold shares traded lower. That is until October, 2002 (blue oval) when both started moving higher in unison. This eventually became known as the "reflation trade", and 2003 was the year that all asset classes traded higher thanks to the easy monetary policies of the world's central banks. Now that that trade is unwinding, gold and all the world markets are headed lower, and in some respects you can argue that gold is leading way. As gold deflates, so do the markets.
Figure #4/ SPY-$XAU (weekly)
So what drove gold and gold shares higher? Was it the historically low interest rates? Was it the weakness in the dollar? And more importantly, what can we infer from the past as to what might drive prices higher in the future? The answers to these questions will be addressed in parts II and III of this look at gold and gold mining shares.
The Technical Take
$ gold mining sector oversold
$ gold mining sector needs to consolidate before any sustained move higher is possible
$ fundamental drivers to be discussed in next issues
Thanks for reading and I hope you have found my analysis informative, insightful and profitable....
If you would like more information regarding my methodologies, please contact me at blueguyzee@yahoo.com.
Addendum: What is Price Structure Analysis?
Price Structure Analysis defines areas of support and resistance formed by significant thrusts up or down in price. Significant is meant to be price thrusts that exceed certain volatility characteristics. On the price charts, significant up thrust are marked with a line of red dots; down thrusts are marked with a line of black dots. These pivots not only serve as areas of support and resistance but also they can be coupled together to define an uptrend or a down trend.


