


I feel like the robot in the television show, "Lost In Space". Investor sentiment remains bullish and trends in gold, crude oil, and yields on the 10 year Treasury bond are collectively becoming extreme as well. Thiscombination has me thinking: "Danger, Danger Will Robinson".
Yesterday, I presented our combination sentiment indicator and our indicator that measures the trends in gold, crude oil, and yields on 10 year Treasury bonds. As stand alone indicators, each of these would suggest caution on equities. Together they work synergistically. For example, with regards to our combination indicator constructed from the trends in gold, crude oil, and 10 year Treasury yields, the data was reasonably compelling to suggest that when these trends are strong (as they are now) that it is a headwind for equities. The data is more compelling when we consider both sentiment and trends in gold, crude oil, and yields on 10 year Treasury bonds.
Figure 1 is a weekly chart of the S&P500. The red dots over the price bars are those times when both sentiment was bullish and our combination indicator was in the extreme zone suggesting strong trends in gold, crude oil, and yields on the 10 year Treasury bonds. The chart goes back to 2004, which is the time our sentiment indicator starts.
Figure 1. S&P500/ weekly
This data is more suggestive of a market top than a lift off to a new bull run. The only thing that would change my mind regarding this is if some of the shorter term measures of sentiment (i.e., like the Rydex asset data) were persistently bearish (i.e., a bullish signal). As a representative sample of market participants, these short term traders were betting against the market mid-July, 2009 to mid - August, 2009 when the market went on a moonshot and the "this time is different" scenario unfolded. No doubt short covering had something to do with this.
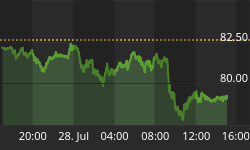
Lastly, I believe the market is setting up for a reversal. The other day I made "The Bearish Case For Equities," and I used the Ultra Short S&P500 ProShares (symbol: SDS) as an example. I explained how a weekly close below the key pivot at 33.57 would be a good sign of a continuation move for equities. In other words, if SDS closes below 33.57 on a weekly, then expect higher equity prices. This is a true statement as key pivots act as support and resistance and we are below support here on SDS. The key pivot at 33.57 is now resistance.
However, this is also the time where there are reversals or "fake outs", and with sentiment modestly bullish and with trends in crude oil, gold, and yields on the 10 year Treasury strong, I believe there is a reasonable chance that the market is setting itself up for such a scenario. We cannot have a reversal without a close below the key pivot. So today's action is the first step in the process. If equity prices do continue higher, then it is my expectation that it will be at the grinding pace we have seen over the past 4 months.
I know this is somewhat controversial, but it is consistent with the data and the price action. The price action is good despite the lack of volume; all the other data suggests headwinds. Putting it together, there is a higher than likely chance of reversal.


