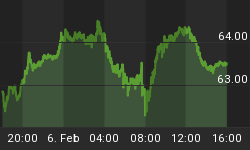
Today is the kind of market day where our stop loss mantra comes into better focus. Remember that at some level, tight or wide, you will be well served by stop loss orders on your positions. The 2008 debacle didn't hurt so much for those with stop loss orders.
Setting the stop loss as a trailing percent or a fixed price amount is a matter of choice and frequency of attention to prices. We prefer trailing percentages.
Selecting the stop point or percentage is a matter of personal choice and some degree of art, but to be well done, it requires access to good chart data (unless you wish to put on arbitrary percentage of positions, which is OK, but perhaps too crude).
The attached spreadsheet provides links to multiple charts, each of which could be useful, and which collectively are definitely useful, in choosing stop loss points or percentages. It also contains a recommended list of securities to examine through those charts to get a world view of markets.
Over time, you will probably find that you prefer one chart over the others, or one indicator on a chart over the others to set stop loss points, but before then, here is a good collection of useful aids.
I look forward to discussing stop loss orders and the use and interpretation of these charts with you.


