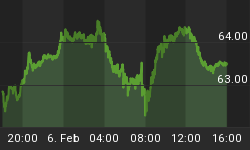
It has been an interesting week in the market as stocks and commodities push to extreme support levels. Below I have posted some charts showing where the market is currently trading at and what I think is likely to unfold.
Gold Futures - 4 Hour Candle Stick Chart
The price of Gold is testing a key support level. I figure we will see gold try to stabilize over the next week or so as it digests the recent drop in value then start to head back up.

US Dollar Index - 60 Minute Candle Stick Chart
The US Dollar and gold have been moving together the past few weeks as more countries pop up on the radar for serious financial issues. This is helping to boost both the US Dollar and gold as investors around the world starting buying what seems to be safety. The dollar has had a sizable pullback and is now testing a key support level.
This could be the start of a possible Head & Shoulders pattern forming which means the dollar rally could be nearing maturity in the next couple weeks.

Crude Oil Futures - Daily Trading Chart
Oil has been under serious selling pressure because of the rising USD. It has now dropped to a key support level and is starting to look very interesting. If the US Dollar bounces in the next week or two it will keep downward pressure on oil. I think this bottom is going to be a process not a one day event.

SP500 - Daily Trading Chart
Stocks have been under dropping like flies the past few weeks and shorting the SP500 last week at 1170 has played out very nicely for members. The broad market is giving me mixed signals and when I am unsure of a trade I stand on the sidelines. It's always better to sit in cash and watch things stabilize than it is to watch your hard earned money evaporate. We could see a wave of panic selling in the stock indexes testing the previous lows so be cautious.

Mid-Week Stock & Commodity Trading Report Conclusion:
In short, I feel gold and the dollar will bounce in the coming days from their support levels. This will keep pressure on oil & the SP500 holding them down near support. Once the US Dollar forms a possible right shoulder we will most likely see them pop and rally.
We are still 7 trading days away from a cycle low on the broad market making this scenario very likely to play out. At the moment I am getting a lot of mixed signals and during times like this I prefer to stay in cash because volatility will rise and it is easy to get shaken out of trades.
If you would like to get my Real-Time Trading Signals & Setups checkout my services at www.TheTechnicalTraders.com.


