


I thought I would address some reader comments and questions.
Reader D-man asked about the chart of the EURUSD cross rate. See figure 1 a weekly chart. Last week's close 0f 1.25652 was still below the key pivot point at 1.25674. This is resistance. So the trend remains down. Interestingly, this week prices are forming a positive divergence bar; these are the price bars in red. Typically found at market bottoms, it should be remembered that closes below the low of the positive divergence bar may lead to further and accelerated selling. So it is not a given that this is the bottom.
Figure 1. EURUSD/ weekly
Readers Ryan and Fu Manchu have expressed interest in the USDJPY. This is a position that I believe has great potential to see the YEN go lower, but after 5 months, I am still waiting. I took myself out of the position last week to better control my risk as it appeared that the risk trade was tied to unwinding of the carry trade. In any case, when looking at the weekly chart of the USDJPY, we note that price remains above 3 key pivots and this is bullish. The EURJPY is in the lower part of its range. That's ok and we will just keep the USDJPY on our radar screen.
Figure 2. USDJPY/ weekly
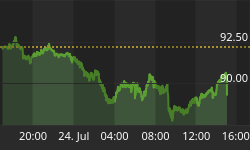
Looking at a daily chart of the Currency Shares Japanese Yen (symbol: FXY), we see that the YEN has pulled back to support at 109.46. If this level doesn't hold, it might be worthwhile to start tip toeing back into the short the YEN trade.
Figure 3. FXY/ daily
Reader TL and good friend (who provides us the "Morning News Notes") was wondering if long term Treasury yields were making a head and shoulders bottom. As TL states: "What a great way for the 20 plus year bear market in Treasury yields to end - in an head and shoulders bottom." See figure 4.
It is possible, but from my perspective, Treasury bonds now have the characteristics of an asset class that could go higher for a long time. I know that is hard to believe with yields so low, but it is what it is. In addition, the cluster of negative divergence bars (pink bars inside gray oval) has been a reliable sign of a market top in yields.
Figure 4. $TYX.X/ weekly


