


The U.S. economy has been out of the intensive care unit for several months. However, discussions are underway as to whether artificial support may be needed again as signs of significantly anemic economic activity have emerged. The combination of lackluster growth and disinflation in the U.S. has led to comparisons with Japan's dire experience following the collapse of asset prices in the 1990s. A frequently cited question in relation to the U.S. economic predicament is if Japan's "lost decade" will play out in the United States. The Q&A below identifies similarities and differences in the experience of the two countries, with an emphasis on the recovery path. It appears that the U.S. is unlikely to mimic the economic path of Japan in the 1990s. In the interest of brevity, we have narrowed the comparison to only a few key issues.
Q1: What is the peak to trough decline of the Nikkei 225 in the 1990s? How do swings in the S&P 500 during the current crisis compare?
Japan: The Nikkei 225 peaked at 38,915.87 as of the end of December 1989. Over the next two years it shed 40% that to-date has yet to return. By October 1998 the Nikkei was at one-third of its all-time high, and briefly fell beneath 20% of the peak in April 2003. Its post-peak low was March 2009, at 7,568.42 - a mere 18.15% of the value witnessed as of end-1989.
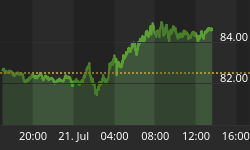
USA: In the U.S., the S&P 500 peaked at 1539.66 in October 2007. Over the next seventeen months, the S&P 500 declined 50.8% to establish a trough in March 2009 at 757.13. An approximately similar decline in Japan occurred over a period of 27 months. The August 2010 average of the S&P 500 at 1087.28 represents a 43.6% increase from the low in March 2009.
Chart 1
Conclusion: The recovery path of the S&P 500 appears to be a quite different from the Nikkei 225, for now.
Q2: When did Japan enter a recession following the peak of Nikkei 225 in December 1989? When did the U.S. downswing in economic activity commence after equity prices peaked in October 2007?
Japan: The Japanese economy was performing well when the Nikkei peaked, and did not fall into recession until mid-1992. However, this sharp drop from growth rates of over 6% to mild contraction proved very disruptive to the economy. The recession lasted for eight quarters, and the economic recovery did not have the strength witnessed in the previous cycle.
Chart 2
USA: The United States entered a recession in December 2007 a short span of two months after equity prices established a crest in October 2007. It is widely held that the U.S. recovery commenced in June/July 2009 and four quarters of growth have occurred after the longest and deepest recession since the Great Depression. A continued business expansion is the most likely prediction, albeit at a slow pace in the rest of 2010. The outlook for 2011 is marked with the termination of the fiscal stimulus package in the early part of the year, with the private sector expected to take over and maintain self-sustained economic growth.
Chart 3
Conclusion: The U.S. economy recorded a sharp downswing in economic activity much sooner than Japan after the collapse of asset prices but the policy responses to the crisis have been more aggressive and rapid in the United States.
Q3: What has been the loss in terms of real GDP compared with the potential GDP in the two nations?
Japan: The economy expanded at an annualized rate of 6% in nominal terms throughout the 1980s, but only averaged a 0.8% increase in the 20 years afterward. During three of the four post-bubble recessions, the total economy contracted, in part due to strong deflationary forces but also due to dramatic drops in the real economy. Estimates differ as to the scope and magnitude of the loss in economic potential during the "lost decade," but the IMF placed the total output loss during that period at approximately 17.6% of GDP.
Chart 4
USA: Real GDP has declined, roughly, eight percent from potential GDP during the deepest phase of the recession. The recovery has been tepid after four quarters of economic growth and real GDP in the second quarter of 2010 was approximately 6.4% short of potential GDP (see chart 5).
Chart 5
Conclusion: The loss of output in the U.S. economy is significantly smaller vs. Japan's experience during the recession.
Q4: A sharp plunge in home prices was at the heart of the crisis in the U.S., what was the magnitude of the decline in real estate prices in Japan?
Japan: Real estate prices were considered overvalued as early as 1986, yet escalated a further 94% over the next three years according to the leading Tokyo Metro index. By 1990, the average Tokyo condominium cost ¥59.7 million ($412,000), with high-end properties well in excess of $10 million. When the recession hit in 1992, prices had fallen by 17.8%, and at its lowpoint in 2002, these values had fallen off by a full third.
Chart 6
This depreciation factored heavily into the plight of the banking system in two ways. First, overvalued properties were financed under the presumption of continued strong gains, and the reversal of fortune in real estate left a number of these properties "under water" (with negative net equity). Secondly, properties were used as the underlying collateral for even larger development financing. This carried a two-pronged problem, as the depreciation of the collateral increased leverage ratios dramatically, and as values dipped, the profitability of the development fell as well.
USA: Sales of homes and single-family home construction were unusually steady through the 2001 recession and posted extraordinary gains in the following four years. Home prices rose significantly during this period and more than doubled in a few metro areas. At the peak of the boom in the housing market, the median price of an existing single-family home had risen nearly 13% (see chart 7). As the crisis deepened, home prices posted the largest decline on record in the post-war period. On an annual average basis, the decline in the price of an existing single-family was in 2007 was the first drop in the history of the entire data series (see chart 7). The U.S. economy is yet to register meaningful self-sustained growth following the adverse ramifications of the decline in home prices and the collapse of the housing market.
Chart 7
Conclusion: Although the decline in prices of existing homes was without precedent in the US, the run-up in property prices was comparatively larger in Japan. Going forward, a multi-pronged approach to a significant reduction in mortgage foreclosures in the United States is essential for stability of not only the housing market but also of the overall economy.
Q5: What role did deflation play in the wake of the Nikkei collapse? Are consumer prices headed in a similar direction in the U.S. economy?
Japan: When the Nikkei peaked, inflation was on the rise and of greater concern to the Bank of Japan than the correction in the stock market. The CPI peaked on a year-over-year basis in November 1990, and interest rates rose throughout March 1991. By that time, consumer demand was retreating and leading indicators pointed toward recession. After the 1992-94 recession, the effects of collapsing asset prices were in full swing, private consumption was dampened by weak confidence, and the financial system was heading toward crisis. The first incidence of deflation appeared in July 1994, and with the exception of two brief price spikes (1997 from a consumption tax increase and 2008 from a sharp rise in oil imports), deflation has been the rule more than the exception.
Chart 8
USA: The year-to-year declines of the Consumer Price Index (CPI) during March 2009 - October 2009 in the U.S. make up the longest stretch of deflation since the early-1950s. A turnaround in business activity supported by extraordinary financial and economic measures has raised the CPI in the subsequent months to record positive year-to-year movements since November 2009. However, the CPI shows a decelerating trend in the April-July 2010 period. The core CPI, which excludes food and energy, has held at 0.9% year-to-year gains for four straight months ended July, which is a new record for this price measure. Against this backdrop, slowing economic growth in the second quarter of 2010 and projections of weakening business conditions in the second-half of 2010 have raised the probability of a deflationary situation in the U.S.. In this context, Chairman Bernanke's noted on August 27, 2010 that the Fed "will resist deviations from price stability in the downward direction." Bernanke also indicated that "falling into deflation is not a significant risk for the United States at this time, but that is true in part because the public understands that the Federal Reserve will be vigilant and proactive in addressing significant further disinflation." The deflationary situation of the Great Depression and the more recent case of Japan are etched in the minds of the FOMC such that the Fed would take the steps necessary to prevent it from becoming the norm in the United States.
Chart 9
Conclusion: The institutional arrangements in the United States are vastly different from those in Japan. The dual mandate of the Fed of price stability and full employment keeps the Fed operating in a different policy landscape compared with the Bank of Japan. The Fed is explicitly accountable to Congress and there is a great deal of transparency in Fed communications with the market. Although the Fed and the Bank of Japan have no explicit inflation targets, the Fed publishes implicit targets and financial markets are fully aware of these preferences. The less accountable institutional structure of the Bank of Japan has allowed for deflation to persist. Also, the Fed is strongly determined to prevent deflation in the United States, particularly against the backdrop of the criticism regarding the Fed's premature and inappropriate policy actions in 1936-37 which prolonged the Great Depression. The dollar's unique role as an international reserve currency is another factor supporting only a small probability of deflation in the United States.
Q6: How did Japan go about addressing problems of the banking sector? How has the U.S. tread on this course?
Japan: While the major Japanese banks felt the impact of the Nikkei's fall quickly, no institution took drastic action during the first couple of years. By the end of the first post-bubble recession, only one major bank announced significant loan write-offs, and it was apparent that the unofficial policy in the financial sector was to loan more funds to struggling companies so they could service already-troubled loans. The BoJ was recommending greater amounts of write-offs but did not set forth formal provisions. In 1995, the government funded the first of several bailout packages, but the programs did not incorporate corrective measures or obligations to make the "main 20" banks write off loans, accept losses and endure the painful process of restructuring (policies mostly unheard of in the post-war financial sector).
It was only in 1997 when the government made a dramatic change in policy and reputation by letting banks fail. The first banks to go under were smaller and regionally-based, but by the end of the year, Hokkaido Takushodu Bank failed and was absorbed by competitors, and in 1998 Long Term Credit Bank (the ninth-largest company in the world by assets before the bubble burst) was nationalized. Other institutions were forced to merge with top institutions under the Obuchi Plan of financial sector consolidation - eight years after the Nikkei hit its peak.
USA: Unlike Japan, authorities responded far more rapidly to the financial market and banking crises in the United States compared with Japan. Central banks responded without delay to the evaporation of liquidity following the disruption of money markets in the summer of 2007. In the U.S., the Fed lowered the discount rate 50 bps and raised the term of discount loans to 30-days from the standard overnight facility. The Fed also set up the Term Auction Loan Facility and the Term Securities Lending Facility to ease pressures from illiquid conditions in short-term markets. On March 13, 2008, the Fed facilitated the takeover of Bear Stearns, the fifth-largest investment bank, by JPMorgan Chase, when it ran out of cash to meet its obligations for the next day. In the wake of this event, the Fed extended discount window loans to primary dealers via the Primary Dealer Credit Facility, a new program, to prevent situations similar to that of Bear Stearns.
The crisis assumed a more severe dimension with the collapse of Lehman Brothers in September 2008 and the liquidity problems of American International Group, one of the world's largest insurance companies. By October 2008, it became apparent that it was a combination of liquidity and solvency issues confronting financial institutions in the United States. The liquidity aspect was addressed, as the crisis unfolded, by the Federal Reserve's authority in unusual and exigent circumstances to flood the system with as much liquidity as it needed. The solvency issue was solved when Congress gave Treasury the authority under the Emergency Economic Stabilization Act of 2008 to provide capital to institutions holding troubled assets under the Trouble Asset Relief Program (TARP). TARP authorized the Treasury to purchase or insure up to $700 billion of troubled assets. Through the TARP's Capital Purchase Program, the Treasury purchased $205 billion in shares of preferred stock from 707 financial institutions. By early-2010, nearly 65% of the preferred stock had been repurchased by 70 of the issuing institutions.
It is also important to note in this context, that the Federal Deposit Insurance Corporation (FDIC) runs the world's most sophisticated program to shut down failing banks in a methodical manner to avoid panics and runs associated with insolvent financial institutions, while at the same time protecting taxpayers. This institutional structure of the United States had one drawback because investment banks were outside the jurisdiction of the FDIC. The new financial reform bill has addressed this shortcoming.
The large scale interventions by the Federal Reserve, Treasury, and the FDIC were mind boggling to the public and it appeared that there was no end in sight. The bottom line was that markets were viewing many banking institutions as shaky and "uninvestable." To remedy this perception, the Supervisory Capital Assessment Program (SCAP) or "stress tests" of 19 financial institutions was implemented. The objective of this program was to assess the capital needs of these institutions in the event of a deeper and longer recession than the most recent experience. The stress tests took three months to be completed and the capital needs of these institutions was established and detailed results of the test were published. The whole exercise was a confidence enhancing procedure to make banks investment-worthy again.
Japan's program for closing down banks in 1990 was all but nonexistent - a politicized financial sector with a mandate for government-directed lending meant that most banks were considered "too important to fail." The first attempts at reforms were through refinancing of bad loans and government support funds on an ever-increasing scale, but without demands for reform, consolidation or tightening of lax lending policies. The several years and billions of yen spent trying to shore up the failing financial sector only created a more desperate situation requiring even more funding when the government finally began closing and consolidating institutions under the Obuchi plan.
Conclusion: The important difference between the United States and Japan is the speed with which the banking crisis has been addressed after the recognition of the problem by policy makers. The Japanese experience is of very recent vintage and provided an example of "what-not-to-do" to a large extent. In the near term, the credit machine needs to function in full-swing to ensure self-sustained economic growth. Positive signs have emerged in bank credit data in the United States, which is encouraging, but additional confirmation is awaited (See more detailed discussion under questions 9 and 10).
Q7: Both the U.S. and Japan faced impaired banking systems and non-performing loans. What is the magnitude of non-performing loans in the U.S.? Where does Japan stand in regard to this matter?
USA: Non-performing loans in the U.S. have risen sharply since the onset of the crisis (see chart 10). They made up less than 1% of total loans in the summer of 2007. In a short span of three years, the percentage of non-performing loans accounted rose to 5.36% in the second quarter of 2010. As a percentage of nominal GDP, non-performing loans are insignificant in comparison with the situation in Japan. Going forward, the challenges of the commercial real estate sector should raise the percentage of non-performing loans. But the stark difference in the size of the non-performing loans, the fact that banks balance sheets are stronger compared with the situation a year ago, and the stress tests of major banks to ensure that they will have adequate capital in the face of new threats are important differences in the route that U.S. and Japan have taken to address banking problems.
Chart 10
Japan: The initial problem with Japan's financial crisis was the reluctance of banks to disclose the amount of bad loans on their books. Major institutions used a variety of methods to under-report their non-performing loan levels - reclassification, dubious refinancing and nondisclosure - which still left the official non-performing loan total equal to $469 billion (about 10% of GDP) as of 1995, though unofficial estimates placed it at over twice that amount. Despite bailout programs and nudges from the BoJ, by 1998 the official tally of non-performing loans had increased 80%. This sharp rise was in part due to revelations of prior loans actually being reclassified as unpayable, but also a further deterioration of overall loan portfolios. Unofficial estimates suggest that the NPL ratio peaked in 2002 at about 35% - over one-third of booked loans were unlikely to be repaid. Massive bailouts, mergers and write-downs over the past eight years have brought this total under control, but at a drastic cost. The total cost to the government is estimated at 24% of GDP during the crisis, without including the additional burden of fiscal stimulus packages meant to keep the economy moving during the period when the financial system as a whole was not an effective generator of credit.
Conclusion: The impending commercial real estate crisis in the United States is widely expected to raise loan losses of banks. A large part of the reason bankers are holding excess reserves is in anticipation of additional loan defaults and delinquencies. Japan failed to address the problem of non-performing assets and allowed structural inefficiencies to fester.
Q8: How did Japan's public debt situation change during the crisis and how does the U.S. experience compare?
Japan: In 1989, the gross public debt burden for Japan equaled a manageable 51.5% of GDP, and went as low as 48.2% in 1991 just before the first recession began eroding revenues and eating into the budget balance. In 1996, when total government bailout funds first exceeded $100 billion, debt had risen to 68.1% of GDP and the weak economy was heading for another recession. By the time the financial crisis peaked in 2002, the combination of government bailouts and fiscal stimulus had pushed total public debt to 130.9% of GDP, and stabilization would take a few more years to gain traction.
Also worth noting is how the massive buildup of debt in the 15 years following the Nikkei bubble factored into the country's current situation. Public debt as a percentage of GDP declined in 2007 for the first time since 1991, nudging down to a still-dangerous 162%. However, government finances were entirely unprepared to respond to the global credit crisis and had minimal room to offer any stimulative spending. If public debt had been below 100% of GDP like the U.S. and most of Europe, Tokyo would have had more options to utilize without disrupting the markets or raising worries about excessive debt. Instead, fiscal stimulus was restrained, the recession was pronounced, and debt is on pace to exceed 200% of GDP by 2011.
Chart 11
USA: Gross federal debt held by the public was 65.5% of GDP in 2007 and the deficit was 1.2% of GDP. Following this not-so-unwieldy budgetary situation, there was a three-fold increase in the deficit as a percentage of GDP to 9.9% in 2009 from 3.2% in 2008. The hefty increase in attributable to weak revenues and a sharp increase in spending associated with the recession and policies implemented in response to it. The Congressional Budget Office (CBO) estimates the federal deficit to be 9.1% of GDP in 2010, the second largest in the past 65 years. The CBO projects that gross federal debt of the U.S. to reach an elevated level of 97.0% of GDP by 2012 and hover in the neighborhood of 95% during the next eight years.
Chart 12
Conclusion: The magnitude of the sovereign debt is relatively smaller in the U.S. compared with Japan. In addition, the U.S. has a demographic advantage which makes the budgetary issues more manageable, provided there is political will to address it. Markets will continue to test the resolve of authorities in both Japan and the United States to put their financial houses in order in the year ahead.
Q9: Is there one single factor that has played a predominant role is restraining economic growth in Japan following the downswing in business conditions? If so, what is the role of this factor in the United States?
Japan: Bank lending in Japan shows a significantly weak trend after the onset of the crisis which is tied both to the banking system's inability to facilitate credit generation and the reluctance of consumers to borrow. At the time of the Nikkei's peak, domestic credit generation was expanding at 26.3% - just shy of its cyclical high of 28.5% two quarters prior. The sharp deceleration and eventual contraction in credit extension lasted until 1995 when housing credit began expanding, but consumer credit generation never did reclaim any sustained strength. The Japanese consumer had become more risk-averse and started saving in excess while putting off major purchases. With the exception of two brief, muted bursts of loan activity, consumer credit has contracted continuously since Q4 1992, and as of Q2 2010 total consumer credit was at 6.3% of GDP, a level last seen in Q2 1998 and well below the peak of 17.5% witnessed shortly before the 1992-94 recession.
Chart 13
USA: The severity and duration of the credit crunch is the United States has trimmed the pace of economic recovery to the extent that it is noticeably feeble compared with other post-war economic upswings, excluding those of 1991 and 2001. The median increase in real GDP during the four quarters of an economic recovery is upwards of 6%, whereas the current four-quarter gain amounts to less than 3.0%. Weakness in bank lending has played a key role in trimming the pace of the economic growth (An extensive analysis of the role of bank credit in the U.S. economic recovery is discussed in the August ![]() U.S. Economic & Interest Rate Outlook). Bank lending is critical for a robust expansion because banks create the purchasing power for borrowers to buy goods and services. Bank credit has posted two consecutive monthly gains and supports our forecast of economic growth in the quarters ahead.
U.S. Economic & Interest Rate Outlook). Bank lending is critical for a robust expansion because banks create the purchasing power for borrowers to buy goods and services. Bank credit has posted two consecutive monthly gains and supports our forecast of economic growth in the quarters ahead.
Chart 14
Conclusion: The recovery of bank credit in the United States casts a strong vote in favor of an economic recovery that will be much different from the record of Japan in the 1990s.
Q10: Against this background, what indicators should one be tracking to assess whether or not the path of the U.S. economy is following in the footsteps of Japan's experience?
At the heart of the current crisis in the U.S. economy is the severe contraction of bank lending and significantly soft labor market conditions. These economic events played out during the recovery process in Japan also. The important difference in the United States is that incoming reports convey small but noteworthy progress on both these fronts as of after four quarter of economic growth, which was not visible in Japan.
Starting with bank lending, the latest Senior Loan Officer Survey points to encouraging developments. The results of the survey indicate increased willingness of bankers to lend to not only medium and large sized firms but also small firms. Tight underwriting standards of loans had reduced the availability of credit, particularly to small firms.
Chart 15
At the same time, the survey also indicates that bankers are more willing to lend to consumers. In sum, credit market conditions on the supply side have taken a turn in the favorable direction. Bank credit holds the key to whether the U.S. economy will establish self-sustained growth as the fiscal stimulus package fades in the early part of 2011. Forthcoming Senior Loan Officer Surveys and bank credit data should provide early indications if the U.S. economy will escape the rolling recession experience of Japan.
Chart 16
Economic indicators from the labor market that should give a heads up on the status of the U.S. economy in addition to bank credit if the U.S. is on a different path compared with Japan. The unemployment rate at 9.6% in August has hovered in the narrow range of 9.5%-9.7% for seven out of the first eight months of the year. Year-to-date, private sector payroll employment has risen 763,000 compared with a loss of 4.66 million jobs in 2009. The big hurdle to cross is the restructuring of the labor force following large declines in employment in the housing and auto sector.
Chart 17
The Japanese experience with job creation in the wake of the Nikkei collapse is nothing short of stunning, particularly considering the importance of employment in local culture. The late 1980s economy was a veritable job-spinner, with unemployment just above 2% of the total labor force yet the employed labor force growing at 1.5-2.0% annually. Job creation stagnated during the 1992-94 recession, but the underlying fragility of the banks and reduced levels of credit generation left businesses hesitant to hire. Job growth only returned in Q2 1996, and lasted about a year before the next recession hit. Employment contracted and the unemployment rate rose from 3.3% (a near-record high at the time) to 4.8% in 1999 and 5.5% in 2002 - a drastic deterioration in the labor situation over the course of a decade. The unemployment rate has recovered modestly, but this has been in part due to a declining labor force - Japanese baby-boomers approaching retirement and a lack of replacement labor. Total employment has sunk to beneath the level seen in August 1990, and the currently weak economy suggests further declines are in the offing.
Chart 18


