• 1,057 days Will The ECB Continue To Hike Rates?
  • 1,057 days Forbes: Aramco Remains Largest Company In The Middle East
  • 1,059 days Caltech Scientists Succesfully Beam Back Solar Power From Space
  • 1,459 days Could Crypto Overtake Traditional Investment?
  • 1,464 days Americans Still Quitting Jobs At Record Pace
  • 1,466 days FinTech Startups Tapping VC Money for ‘Immigrant Banking’
  • 1,469 days Is The Dollar Too Strong?
  • 1,469 days Big Tech Disappoints Investors on Earnings Calls
  • 1,470 days Fear And Celebration On Twitter as Musk Takes The Reins
  • 1,472 days China Is Quietly Trying To Distance Itself From Russia
  • 1,472 days Tech and Internet Giants’ Earnings In Focus After Netflix’s Stinker
  • 1,476 days Crypto Investors Won Big In 2021
  • 1,476 days The ‘Metaverse’ Economy Could be Worth $13 Trillion By 2030
  • 1,477 days Food Prices Are Skyrocketing As Putin’s War Persists
  • 1,479 days Pentagon Resignations Illustrate Our ‘Commercial’ Defense Dilemma
  • 1,480 days US Banks Shrug off Nearly $15 Billion In Russian Write-Offs
  • 1,483 days Cannabis Stocks in Holding Pattern Despite Positive Momentum
  • 1,484 days Is Musk A Bastion Of Free Speech Or Will His Absolutist Stance Backfire?
  • 1,484 days Two ETFs That Could Hedge Against Extreme Market Volatility
  • 1,486 days Are NFTs About To Take Over Gaming?
How The Ultra-Wealthy Are Using Art To Dodge Taxes

How The Ultra-Wealthy Are Using Art To Dodge Taxes

More freeports open around the…

Market Sentiment At Its Lowest In 10 Months

Market Sentiment At Its Lowest In 10 Months

Stocks sold off last week…

Is The Bull Market On Its Last Legs?

Is The Bull Market On Its Last Legs?

This aging bull market may…

  1. Home
  2. Markets
  3. Other

Inflationary Pressures Are Persistent

On November 8, 2010, our composite indicator that looks at the trends in gold, crude oil and yields on the 10 year Treasury registered an extreme value. At that time, I wrote: "A strategy that combines this "fundamental" filter with the 40 week moving average has given a sell signal." With rising Treasury yields and persistence in the trends in gold and crude oil, the composite indicator remains in the extreme zone. This is not the time to buy equities. For those keeping a scorecard at home and for those who are buying the bullish nonsense, the S&P500 has gained about 1% over the last 5 weeks.

See figure 1, a weekly chart of the S&P500 with the indicator in the lower panel. Inflationary pressures are extreme (as are the trends in crude oil, gold and yields on the 10 year Treasury) and this is a headwind for equities. I have discussed this indicator and a trading model that utilizes the indicator at great length in the following articles:

Developing A Trading Strategy (Part 1)

Developing A Trading Strategy (Part 2)

Developing A Trading Strategy (Part 3)

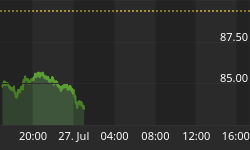
Figure 1. $INX/ inflatonary pressures
$INX/ inflatonary pressures


Back to homepage

Leave a comment

Leave a comment