• 643 days Will The ECB Continue To Hike Rates?
  • 643 days Forbes: Aramco Remains Largest Company In The Middle East
  • 645 days Caltech Scientists Succesfully Beam Back Solar Power From Space
  • 1,045 days Could Crypto Overtake Traditional Investment?
  • 1,050 days Americans Still Quitting Jobs At Record Pace
  • 1,052 days FinTech Startups Tapping VC Money for ‘Immigrant Banking’
  • 1,055 days Is The Dollar Too Strong?
  • 1,055 days Big Tech Disappoints Investors on Earnings Calls
  • 1,056 days Fear And Celebration On Twitter as Musk Takes The Reins
  • 1,058 days China Is Quietly Trying To Distance Itself From Russia
  • 1,058 days Tech and Internet Giants’ Earnings In Focus After Netflix’s Stinker
  • 1,062 days Crypto Investors Won Big In 2021
  • 1,062 days The ‘Metaverse’ Economy Could be Worth $13 Trillion By 2030
  • 1,063 days Food Prices Are Skyrocketing As Putin’s War Persists
  • 1,065 days Pentagon Resignations Illustrate Our ‘Commercial’ Defense Dilemma
  • 1,066 days US Banks Shrug off Nearly $15 Billion In Russian Write-Offs
  • 1,069 days Cannabis Stocks in Holding Pattern Despite Positive Momentum
  • 1,070 days Is Musk A Bastion Of Free Speech Or Will His Absolutist Stance Backfire?
  • 1,070 days Two ETFs That Could Hedge Against Extreme Market Volatility
  • 1,072 days Are NFTs About To Take Over Gaming?
Another Retail Giant Bites The Dust

Another Retail Giant Bites The Dust

Forever 21 filed for Chapter…

Zombie Foreclosures On The Rise In The U.S.

Zombie Foreclosures On The Rise In The U.S.

During the quarter there were…

  1. Home
  2. Markets
  3. Other

Inflationary Pressures Are Subsiding

As this headline from the Wall Street Journal shows, inflation pressures are just beginning to be recognized by investors.

Figure 1. Headline WSJ
Headline WSJ

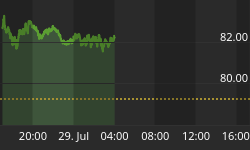
My composite indicator, which is constructed from the trends in crude oil, gold, and yields on the 10 year Treasury and which is a gauge of inflationary pressures, has been at extreme levels for the past 12 weeks. The indicator is shown in figure 2, a weekly chart of the SP500. When the indicator is at such extremes, this is a headwind for equities. However, for the past 3 months while the indicator was at an extreme level, the SP500 rose about 5%. This is not the average expected outcome but certainly within the realm of possible outcomes when the indicator is at an extreme level.

Figure 2. $INX/ weekly
$INX/ weekly

In any case, the indicator is no longer extreme as gold and crude oil have come down in price over the past couple of weeks. So what was a concern of mine several months ago is the "market's" concern this week. The fact that inflationary pressures are subsiding is a positive forthe equity markets especially once the overbought conditions are cleared.


Back to homepage

Leave a comment

Leave a comment