


5/6/2011 9:46:37 AM
Job's surprise - Here's what we're looking for.
I may over use this quote, but life is like a box of chocolates, you never know what you're going to get.
Again, it's not how the market opens, it's how it closes. However, global strength may help out the bullish side.
The key for stocks is how the dollar and bonds react to today's reports. The bonds retraced, which is bullish for stocks. In fact, this is where some of the energy for the advance will come. The second component is the dollar. It's push higher could hold things here. But once the dollar and bonds resume their downside, the market will be set up to rally.
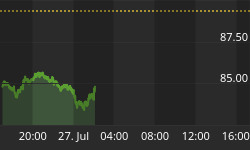
Here is our view of Global Markets.

On the economic front, here is the schedule for this week.

On to the charts:

Stock Barometer Analysis
The barometer remains in Sell Mode. The markets are also oversold. The positive reaction to the Jobs report will be the first test of this market. If bullishness holds, the dollar reverses, and bonds turn lower, that would be a bullish sign.
I don't expect to change position today. However, given the positioning of the barometer, near a relative low, that would suggest caution on the short side and potentially some toe dipping on the long side...
The Stock Barometer is my proprietary market timing system. The direction, slope and level of the Stock Barometer determine our outlook. For example, if the barometer line is moving down, we are in Sell Mode. A Buy or Sell Signal is triggered when the indicator clearly changes direction. Trend and support can override the barometer signals.
Money Management & Stops
To trade this system, there are a few things you need to know and address to control your risk:
- This system targets intermediate term moves, of which even in the best years, there are usually only up to 7 profitable intermediate term moves. The rest of the year will be consolidating moves where this system will experience small losses and gains that offset each other.
- This system will usually result in losing trades more than 50% of the time, even in our best years. The key is being positioned properly for longer term moves when they come.
- Therefore it is vitally important that you apply some form of money management to protect your capital.
- Trading a leveraged index fund will result in more risk, since you cannot set stops and you cannot get out intraday.
Accordingly;
- Make sure you set your stops so that you can lose no more than 2% per trade (based on the QQQQ if you're trading leveraged funds and options with our trading service).
Potential Cycle Reversal Dates
2011 Potential Reversal Dates: 1/15, 1/29, 2/16, 3/10, 3/18, 4/6, 5/21. We publish dates up to 2 months in advance.
If bullishness takes over, the markets will continue higher into May 21. So far, the retracement has been bullish - i.e. building energy while not experiencing much price destruction.
My Additional timing work is based on numerous cycles and has resulted in the above potential reversal dates. These are not to be confused with the barometer signals or cycle times. However, due to their past accuracy I post the dates here.
2010 Potential Reversal Dates: 1/19, 1/28, 3/2, 3/23, 4/7, 5/30, 6/10, 6/28, 7/10, 8/13, 9/7, 10/2, 10/27, 11/21, 12/19. We publish dates up to 2 months in advance. 2009 Published Reversal Dates: 1/20, 2/11, 3/7, 3/15, 4/8, 4/16, 4/27, 5/7, 6/8, 7/2, 7/17, 9/14, 10/10, 10/24, 11/12, 11/30, 12/9, 12/21, 12/29. 2008 Potential Reversal Dates: 12/31, 1/11, 2/1, 2/13, 3/6, 4/5, 4/22, 5/23, 6/6, 6/27, 7/13, 9/2, 10/3, 10/22, 11/10, 12/11. 2007 Potential Reversal Dates: 1/10, 1/14, 1/27, 1/31, 2/3, 2/17, 3/10, 3/24, 4/21, 5/6, 6/15, 8/29, 10/19, 11/29, 12/13, 12/23, 12/31, 1/11/08. 2006 potential reversal dates: 1/16, 1/30, 2/25, 3/19, 4/8, 5/8, 5/19, 6/6(20), 7/24, 8/20, 8/29, 9/15, 10/11, 11/28. 2005 Potential reversal dates: 12/27, 1/25, 2/16, 3/4, 3/14, 3/29, 4/5, 4/19, 5/2, 6/3, 6/10, 7/13, 7/28, 8/12, 8/30-31, 9/22, 10/4, 11/15, 11/20, 12/16.
Timing Indicators
Use the following Timing/momentum indicators to assist in your trading of the QQQQ, GLD, USD, USO and TLT. They are tuned to deliver signals in line with the Stock Barometer and we use them only in determining our overall outlook for the market and for pinpointing market reversals. The level, direction, and position to the zero line are keys in these indicators. For example, direction determines mode and a buy signal 'above zero' is more bullish than a buy signal 'below zero'.
QQQQ Timing Indicator (NASDAQ:QQQQ)

The QQQQ Spread Indicator will yield its own buy and sell signals that may be different from the Stock Barometer. It's meant to give us an idea of the next turn in the market.
Gold Timing Indicator (AMEX:GLD)

Want to trade Gold? Use our signals with the Gold ETF AMEX:GLD. Gold gives us a general gage to the overall health of the US Economy and the markets.
US Dollar Index Timing Indicator (INDEX:DXY)

Want to trade the US Dollar? Use our signals with the Power Shares AMEX:UUP: US Dollar Index Bullish Fund and AMEX:UDN: US Dollar Index Bearish Fund.
Bonds Timing Indicator (AMEX:TLT)

Want to trade Bonds? Use our signals with Lehman?s 20 year ETF AMEX:TLT. The direction of bonds has an impact on the stock market. Normally, as bonds go down, stocks will go up and as bonds go up, stocks will go down.
OIL Timing Indicator (AMEX:USO)

Want to trade OIL? Use our signals with AMEX:USO, the OIL ETF. We look at the price of oil as its level and direction has an impact on the stock market.
Secondary Stock Market Timing Indicator

We daily monitor hundreds of popular and proprietary technical indicators that break down market internals, sentiment and money flow to give us unique insight into the market. We feature at least one here each day in support of our current outlook. As an annual subscriber to any of our services, you will get access to all our charts and research.
Daily Stock Market Outlook
We remain in Sell Mode. We've been looking for the markets to move lower into Friday, today's action is key. It was initially very bullish, but the dollar and bonds are not confirming. The answer will be known as we come into the close. It's a Friday, which is generally bullish. If it can't sustain the bullishness seeing how oversold the market is, we will likely look for one more leg lower.
Above is the Nasdaq New High data. On the trading front, when this indicator reaches a low, and markets rebound, you can look for stocks to move back to new highs. That's actually a good trade and a good way to set a target (giving you a P/L) so you can set your stop accordingly.
Sorry for the delay this am. Watching the markets very closely. The big players tend to wait and let the market show more of it's hand. So expect a bigger move initiating around 10-10:20.
If you're looking for more information, please visit our blog - I'll have updates and publish other articles there. http://investmentresearchgroup.com/Blog/
Regards,


