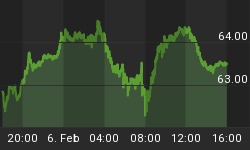
Yesterday's bout of selling in the oil patch was rather unpleasant and quite unexpected. About 3 months worth of gains were wiped out in a single day. Uggh.
I am not sure why the sell off occurred nor did I see any specific news. The Dollar was up but it will take more than one day to erase the current down trend. The Middle East premium is still there and maybe more so. I know speculators are being "targeted", but these are just code words by our "central planners" (read: Federal Reserve) that we want stocks to go up and nothing else.
In any case, my model for crude oil remains bullish on the commodity despite the sell off. However, there is technical damage as you would imagine, and the next two figures will address that issue.
Figure 1 is a daily chart of the United States Oil Fund (symbol: USO). The breakout (see red down arrows to the upper right of the chart) from the prolonged base and rising channel line has not held, and this is not good. On Thursday, USO gapped back into the base formation and into the channel.
Figure 1. USO/ daily
Breakouts that turn into fakeouts are never good, but technically all is not lost for USO. This can be seen in the weekly chart in figure 2. The breakout and subsequent failure from the base are noteworthy. Yesterday's sell off had prices arresting at the next level of support, which is at 38.84. Call it a marginal victory as support was found where it should have been.
Figure 2. USO/ weekly


