


It is rare for me to make a statement regarding the markets unless I have some data to back me up. In the weekly sentiment wrap up, I stated: "since 1991 covering 40 unique instances, the SP500 bottomed 80% of the time with a reasonable risk (<6% draw down) to capital after two consecutive weeks of extreme bearish sentiment; and 2) failure of the market to bottom is a very ominous sign." So let's drill down a little deeper and see what the numbers say and why I would make such a statement.
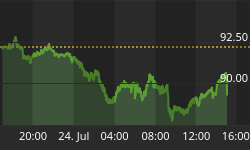
Figure 1 is a weekly chart of the SP500 (symbol: $INX) with the "dumb money" indicator in the lower panel. So here is the study: 1) buy the SP500 when the "dumb money" is bearish for two consecutive weeks; 2) we sell our position when the "dumb money" indicator turns neutral. In other words, we are only in the market when the "dumb money" is green in color, which means investors are too bearish. The data goes back to 1991, and all positions are executed at the close of the week.
Figure 1. SP500/ weekly
Since 1990, there have been 40 unique occurrences or trades yielding 858 SP500 points. Buy and hold only generated 950 SP500 points over the same time period. The strategy was only in the market 20% of the time, so in essence, the strategy yielded an almost market beating return with only 1/5th the market exposure. That is pretty strong. 80% of the trades were profitable. The average trade lasted 5.5 weeks. So far, the results are fairly compelling, but to get an even better picture of why I would make those statements, let's look at every trade from this strategy. To do this we need to look at the maximum adverse excursion (MAE) graph. See figure 2.
Figure 2. MAE graph
The MAE graph looks at every trade from a strategy and determines how much a trade had to lose before being closed out as a winner or a loser. If you are like me, you put on a trade and watch as it goes adverse to its entry price. MAE is the angst factor. At some point, the position is closed out for a win or a lost. For example, look at the trade inside the blue box. This trade initially lost 5.35% (x axis) before being closed out for a 1.77% (y axis) winner. We know this was a winning trade because it is a green caret.
Out of the 40 trades, 33 had MAE's less than 6%; this is to the left of the orange vertical line. In addition, 31 of those 33 trades were profitable. So if you buy the SP500 when the "dumb money" indicator is bearish for two consecutive weeks, then you have an 80% chance your MAE or trade draw down will be less than 6%. To the right of the orange vertical line shows all the failed or bad signals. With 5 out of the 7, the MAE was greater than 10%, and 6 out of 7 were losing trades. That's why I can state that bad signals are ominous.
In sum, I still believe the data supports betting with the market when the "dumb money" indicator turns bearish. It doesn't work every time, but show something that does.
If you would like to have TheTechnicalTake delivered to your email in box, please click here: It's free!!!


