


Hey, what do you expect? Those knuckleheads* who were selling and calling for the end of the world 4 weeks ago are now chasing prices higher and probably calling for a new bull market. As prices have moved higher, the prior extremes in bearish sentiment have given way to neutral readings. Will we end up going to an extreme bullish reading in sentiment, which would likely coincide with higher prices? Difficult to say at this point, but it is likely that a good chunk of this price move has already occurred. Why? There wasn't a consensus amongst the sentiment indicators at the bottom, and short covering (as expressed by the short term Rydex data) has been non-existent. It is just difficult seeing the market moving higher on its own merit. It is still a bullish bias as buyers (i.e., those who missed the rally) will be willing buyers at any sign of weakness, but the market action is likely to be choppy.
The "Dumb Money" indicator (see figure 1) looks for extremes in the data from 4 different groups of investors who historically have been wrong on the market: 1) Investors Intelligence; 2) MarketVane; 3) American Association of Individual Investors; and 4) the put call ratio. This indicator is extremely bearish, and this is a bull signal.
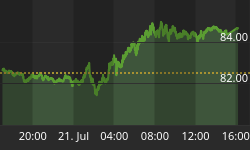
Figure 1. "Dumb Money"/ weekly
Figure 2 is a weekly chart of the SP500 with the InsiderScore"entire market" value in the lower panel. From the InsiderScore weekly report: "Market-wide insider sentiment was neutral despite the fact that sellers outnumbered buyers by a nearly four-to-one ratio. The holiday and earnings lock-ups constrained volume and some seasonal factors - a number of companies popped up with cluster sales due to the annual vesting of restricted stock awards - led to an uptick in selling. There were, however, two negative signs worth keeping an eye on: The number of 10b5-1 plans hitting their initial trigger hit a four-week high and, for the first time since late April/early May, Sell Inflections outnumbered Buy Inflections. Transactional volume should decline this week before reaching a low point next week as companies prep their Q2'11 earnings reports."
Figure 2. InsiderScore "Entire Market" value/ weekly
Figure 3 is a weekly chart of the SP500. The indicator in the lower panel measures all the assets in the Rydex bullish oriented equity funds divided by the sum of assets in the bullish oriented equity funds plus the assets in the bearish oriented equity funds. When the indicatoris green, the value is low and there is fear in the market; this is where market bottoms are forged. When the indicator is red, there is complacency in the market. There are too many bulls and this is when market advances stall.
Currently, the value of the indicator is 62.26%. Values less than 50% are associated with market bottoms. Values greater than 58% are associated with market tops.
Figure 3. Rydex Total Bull v. Total Bear/ weekly
*This is not a matter of being right or being wrong; it is one of emotion and having a plan and executing that plan!
If you would like to have TheTechnicalTake delivered to your email in box, please click here: It's free!!!
Let me also remind readers of our Premium Content service, which focuses on daily market sentiment and the Rydex asset data.


