


Dr. Copper, that metal with a Ph. D. in economics, isn't looking so hot. In fact, it is at a reasonable risk of breaking down thus highlighting the current risks in the global economy.
Figure 1 is a weekly chart of a continuous futures contract for copper going back to 1991. The black dots on the price bars are key pivot points, which are the best areas of support (buying) and resistance (selling). This past week, price closed below a nearby key pivot, and I believe that this puts copper at significant risk of lower prices as a prior area of buying support has not held. In essence, breaks of support define a down trend.
Figure 1. Copper/ weekly
Let's look at the evidence by defining a study. Let's buy copper when prices close below a prior key pivot point as they have done this past week. All positions will be exited either when the key pivot point is recaptured (i.e., prices close above resistance thus reversing the trend from down to up) or after 12 weeks have elapsed.
Such a study produces the following maximum adverse excursion (MAE) graph. See figure 2. The MAE graph looks at every trade from a strategy. Because very few traders and investors ever pick the exact bottom, MAE measures how much you had to lose before a particular trade or investment is closed out for a loss or a win. MAE is the angst factor that measures in percentage terms how much a trade moves against its entry price. See the red caret inside the blue box in figure 1. This one trade had an MAE (or draw down) of 9% (look down the x axis) before recovering to be closed out for a 4% loss (look up the y axis). We know that it was a losing trade because it is a red caret.
Figure 2. MAE Graph
Now look to the right of the orange line. 7 out of 23 trades had MAE's greater than 8% over the following 12 weeks. This suggests to me that there are risks of further deterioration in copper prices as it has broken below a key pivot point. This would also be consistent with the current reports of weakness seen in the global economy. (See Roubini here.)
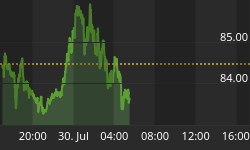
On the other hand and as we all know from trading, support levels can be broken yet prices can recover those levels rather dramatically leading to strong moves. In this case, I would not look to get long copper until prices break above the current key pivot point at 4.1078; in addition, as long as copper is below this level, the global economy remains on recession watch.


