



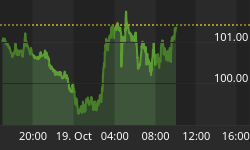


Today's shellacking in gold and Treasury bonds should remind investors that no trend goes on forever.
Of course, determining when a price thrust will end is very difficult to do, and probably can only be determined in hindsight. Who knew today was going to be the day? Not I. In any case, it is too early to determine the long term significance of this two day sell-off as the fundamentals remain strong for both gold and Treasury bonds, but on a short term basis, the persistent up moves in Treasury bonds and gold appear to be over. If the fundamentals (i.e., weak economy) for gold and Treasury bonds remains strong, which seems likely, then I would expect a period of consolidation before prices head higher.
Figure 1 is a daily chart of the i-Shares Lehman 20 plus Year Treasury Fund (symbol: TLT). The gold and black dots represent key pivot points, which are the best areas of buying (support) and selling (resistance). The 108.20 key pivot should have been support, and a close below this level is a sign that the price thrust in TLT is over for now. Old support becomes new resistance.
Figure 1. TLT/ daily
Figure 2 is a daily chart of the SPDR Gold Trust (symbol: GLD). A similar price pattern where support is broken highly suggests that GLD needs a breather. 173.49 is now resistance.
Figure 2. GLD/ daily
As far as the significance of these developments, it is difficult to say. The market seems fixated on Ben Bernanke at Jackson Hole, and maybe he isn't going to be offering up the treats that market participants appear to be expecting. Gold and Treasury bonds should drop if the Chairman doesn't act or do something, anything like Operation Twist. Then again, if the Fed is going to sit tight, why are equities rallying? Yesterday, I highlighted the Dollar Index as a market "tell", and the lack of a breakdown in this issue would suggest that the Fed is doing nothing. The fact that the Dollar isn't rising probably doesn't mean anything.
As usual, none of it makes sense until it does.





