• 601 days Will The ECB Continue To Hike Rates?
  • 601 days Forbes: Aramco Remains Largest Company In The Middle East
  • 603 days Caltech Scientists Succesfully Beam Back Solar Power From Space
  • 1,003 days Could Crypto Overtake Traditional Investment?
  • 1,008 days Americans Still Quitting Jobs At Record Pace
  • 1,010 days FinTech Startups Tapping VC Money for ‘Immigrant Banking’
  • 1,013 days Is The Dollar Too Strong?
  • 1,013 days Big Tech Disappoints Investors on Earnings Calls
  • 1,014 days Fear And Celebration On Twitter as Musk Takes The Reins
  • 1,016 days China Is Quietly Trying To Distance Itself From Russia
  • 1,016 days Tech and Internet Giants’ Earnings In Focus After Netflix’s Stinker
  • 1,020 days Crypto Investors Won Big In 2021
  • 1,020 days The ‘Metaverse’ Economy Could be Worth $13 Trillion By 2030
  • 1,021 days Food Prices Are Skyrocketing As Putin’s War Persists
  • 1,023 days Pentagon Resignations Illustrate Our ‘Commercial’ Defense Dilemma
  • 1,024 days US Banks Shrug off Nearly $15 Billion In Russian Write-Offs
  • 1,027 days Cannabis Stocks in Holding Pattern Despite Positive Momentum
  • 1,028 days Is Musk A Bastion Of Free Speech Or Will His Absolutist Stance Backfire?
  • 1,028 days Two ETFs That Could Hedge Against Extreme Market Volatility
  • 1,030 days Are NFTs About To Take Over Gaming?
  1. Home
  2. Markets
  3. Other

TLT: Another Great Set-up

The last time I identified a "great set up" it was in the Market Vectors Gold Miners (symbol: GDX). This was only a couple of days ago, and since that time, the GDX is up nearly 10%. Another great set up is brewing as well, and this time it is in the i-Shares Lehman 20 plus year Treasury Bond Fund (symbol: TLT).

Here is the set up. My bond model, which uses intermarket inputs, remains positive. This model has been positive since March 11, 2011. Within the context of positive fundamentals for higher bond prices, we have the following technical set up, which is best shown in the daily chart of TLT. See figure 1.

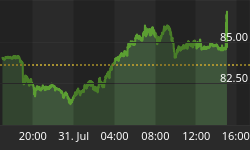
Figure 1. TLT/ daily
TLT Daily

The black and gold dots represent key pivot points, which are the best areas of support (buying) and resistance (selling). The most recent key pivot at 114.24 should have acted as support, but it did not. However, it is not unusual for prices to briefly trade below support levels -taking out the "weak hands" -- and then quickly reverse back through that old support level leaving the sellers on the sidelines. This is "typical" bull market action especially in those trends driven by positive fundamentals. Therefore, a daily close above 114.24 would be bullish. This is another low risk set up as I would not want to see TLT trading below the recent weekly lows (~113).


Back to homepage

Leave a comment

Leave a comment