


It's been a lonely start to 2012 - here in the bear's den. Solitude has its virtues, but after a while your thoughts start to echo against themselves. Time, just like the elements, has a certain friction that under the right conditions can erode a thought or belief down to an unfamiliar shape. Where they once were lucid and complete, they now appear altered - almost amorphous. The more time passes, the less assured you can become of your own dogma.
Dogma.
So dangerous to have - as combustible as black powder, yet as necessary as the steering wheel of your car. Many folks trade what they see and attempt to make a return off a certain objectivity of the system. "Price pays" is a familiar adage among traders. A formula or quantitative design that attempts to interpret and exploit the signals of price.
If it was only that easy.
Price pays - but it can and often misrepresent. In a healthy bull market, price pays almost weekly and twice on Monday's. But this is anything but your typical market environment. Just because it's 2012 does not change the character that was actively present in December of 2011. Correlations have certainly broken down and likely responsible for some of the asset class divergences we have seen recently, but don't get too carried away with the bull's thesis - it's weak.
I tend to approach the market these days more through the perspective of scale - one that starts at the macro level and works its way down to the hourly chart. A fractal approach, if you will, that relies upon my own belief that the market is in the throws of a blowoff top - which to the point, has magnified itself in literally the most unloved and bereaved corners of the market. I am fully aware of the Dogs of the Dow strategy - but believe there is a fine print caveat that reads, "If every dog has its day by the first Wolf Moon in January - the Dow just may be rabid. " Ok - so I made that up. The point is, this exuberance we are currently experiencing will likely mislead those strictly following price. This is an environment where classical technical analysis will fail. I want to know more than price. Price - contrasted with momentum and volatility. Price - contrasted between asset classes. Sentiment - contrasted where capital is positioned. Forget the retail investor, we heard that argument before in 2007 at the top. "The retail investor has yet to participate, therefore..."
Epic Fail.
Private capital, despite the misleading phrase of "money on the sidelines" - is heavily invested. Below is a chart that illustrates just how stretched the private purse strings were as of December. And while ETFs are undoubtedly increasing their share of the capital pie - the chart does impress the point that investors have yet to run for the hills to the same degree that they did so during the last secular low.

Institutions are the only players in town and the Fed is doing everything they can to entice their risk appetites back to the trough. The problem, complicated by the backdrops of Europe and a now decelerating China, is inflation expectations are declining in Europe and across Asia - and are already extremely low here. Not exactly the primordial environment for a new bull run in equities. Because we ignited the crisis in 2007, we had a head start in confronting the deleveraging and disinflationary environment. However, it does not make us immune from the swirling disinflationary winds now circulating the globe. This is a significant downshift in velocity since the lows in March 2009. There have been 61 monetary easings across the globe over the past 4 months. Remind me again through recent history why this should be interpreted as bullish for equities if your market expectations are longer than the ephemeral highs these moves initially illicit?
"Don't fight the Fed!" - came right before, "How could the Fed let this happen!" in 2007 and 2008.
Due to the globalization of the financial system, we are all in this together, no matter where we are in the recovery - ad nauseam, ad nauseam ... ad (#$%&!) nauseam.
As witnessed by the trend lower in volume since the October lows, the markets are extending themselves on what could only be described as vapors. I have questioned the health of this move since 1280 and honestly did not expect the last 15 points in the SPX. In my note in December describing where I thought the limits of the move would be, I stated:
"The respective momentum metrics colored my expectations for a slightly weaker market, hence a deeper pivot than the comparative analog. This difference is one of the primary reasons why I believe the market will have a lower proportional high than the comparative period in May. In May, the market exceeded the March high by approximately 2%. That comparison would roughly work out to a target high for this move to ~ 1318. I believe that will not be reached, with 1300 serving as the top of the range for this move." - "Blowing Off"

Now that we are bumping up against SPX 1318 - what am I looking at for guidance going forward?
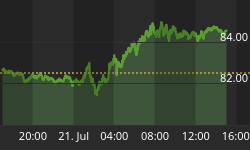
I'm looking down under at the Australian Dollar. In yet another proxy for risk, so goes the Aussie - so goes the next 50 points in the SPX.


