


1/24/2012 8:51:52 AM
Up, down, and finish where you start...
Recommendation:
Take no action.
Click here to access our stock market chat rooms today! For a limited time, try our chat room for free. No subscription necessary to give it a try.
Stock Market Trends:

- ETF Positions indicated as Green are Long ETF positions and those indicated as Red are short positions.
- The State of the stock market is used to determine how you should trade. A trending market can ignore support and resistance levels and maintain its direction longer than most traders think it will.
- The BIAS is used to determine how aggressive or defensive you should be with an ETF position. If the BIAS is Bullish but the stock market is in a Trading state, you might enter a short trade to take advantage of a reversal off of resistance. The BIAS tells you to exit that ETF trade on "weaker" signals than you might otherwise trade on as the stock market is predisposed to move in the direction of BIAS.
- At Risk is generally neutral represented by "-". When it is "Bullish" or "Bearish" it warns of a potential change in the BIAS.
- The Moving Averages are noted as they are important signposts used by the Chartists community in determining the relative health of the markets.
Best ETFs to buy now (current positions):
Long DIA at $122.48
Long QQQ at $56.01
Long SPY at $126.17
Click here to learn more about my services and for our ETF Trend Trading.
Value Portfolio:
We publish new reports to our free newsletter every month. If you're not a member, sign up by clicking here: Free Stock Market Newsletter
Daily Trading Action
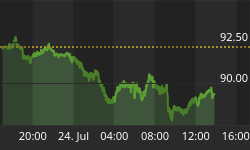
The major indexes opened mixed and that was how they closed. In fact, the major index ETFs closed very close to where they opened leaving behind doji candlesticks which signals indecision among market participants. The major indexes moved higher for nearly one hour before rolling over to race lower through the remainder of the morning. The bulls reasserted control shortly into the lunch hour and the major indexes battled higher the remainder of the session to closed mixed either side of the flat line with the Dow closing just below flat line while the S&P-500 and the NASDAQ-100 closed just above the level of stalemate. The semiconductor index (SOX 413.09 -1.25) slid three tenths of one percent. The Russell 2000 (IWM 78.15 +0.10) posted a modest loss. The Dow Jones Transport Index (IYT 93.40 -0.68) posted a fractional loss. The Bank index (KBE 21.73 +0.01) closed flat while the Regional Bank Index (KRE 26.32 -0.14) slid one half of one percent. The Finance Sector ETF (XLF 14.19 +0.05) added a fractional gain. All equity indexes we regularly report on are above their respective 200-DMAs. All equity indexes have a BULLISH BIAS. Long term bonds (TLT 116.24 -0.74) fell nearly two thirds of one percent. It is in a trading state and has a NEUTRAL BIAS. Trading volume was quite light on the NYSE with 666M shares traded and on the NASDAQ with 1.480B shares traded.
There were no economic reports released. The first economic reports for the week are due out on Wednesday.
Four economic sectors moved higher including Energy +0.7%, Tech +0.4%, Financials +0.3%, and Utilities +0.3%. The other six economic sectors in the S&P-500 moved lower led by Telecom -0.8% and included Health Care -0.5%, Industrials -0.3%, Consumer Staples -0.2%, Consumer Discretionary -0.2%, and Materials -0.1%.
The U.S. dollar fell six tenths of one percent. The Euro rose eight tenths of one percent.
The yield for the 10-year note rose four basis points to close at 2.07. The price of the near term futures contract for a barrel of crude oil rose twenty-five cents to close at $98.58.
Implied volatility for the S&P-500 (VIX 18.67 +0.39) rose two percent as did the implied volatility for the NASDAQ-100 (VXN 19.42 +0.45).
Market internals were mixed with advancers leading decliners 7:5 on the NYSE while decliners led advancers 5:4 on the NASDAQ. Up volume led down volume 3:2 on the NYSE while down volume edged up volume on the NASDAQ. The index put/call ratio rose +0.59 to close at 1.83. The equity put/call ratio rose +0.13 to close at 0.65.
Conclusion/Commentary
Monday's trading was on very light volume and resulted in close to a flat close with mixed results. The initial move higher by the bulls was countered by the bears, which was then countered by the bulls. The major indexes moved in a fairly broad trading range but closed mostly unchanged.
Implied volatility increased significantly at the open and varied through the day but closed up just about two percent. The price to buy puts for downside protection is still reasonable as compared to prices over the last few years. We will want to employ some of this soon because the risk of a larger downside move occurring is growing. Once again, judging precisely when it may take place during a liquidity fueled advance is perhaps the most difficult thing to do in trading.
We believe we are likely to see at least one more short squeeze to put in an exaggerated top before the markets will begin to march down in earnest. We would like to purchase some downside protection but the cost of doing so for our "event horizon" is too high at this time. We continue to expect that another shock from Europe (Greek debt negotiation?) or elsewhere will soon rattle the bullish sentiment that has grown to be too complacent. With that said, this liquidity fueled advance (as money comes out of the bond market) could last longer than most market participants can remain in their short positions.
We won't reiterate what we wrote after Friday's close but rather say that we are still looking for our opportunity to add downside protection at a reasonable cost. It appears as if Tuesday will be a weak day in the markets and one where we see the markets closing lower. With that said, there are too many market observers calling this a "top" for it to have a high likelihood of actually being a top. Therefore, we will, once again, sit on our hands.
We hope you have enjoyed this edition of the McMillan portfolio. You may send comments to mark@stockbarometer.com.


