
How did our Chart-Cast Pilot subscribers fare amid Friday's collapse in Crude? To answer this we must first go back to our short-term position in the days just prior to Friday's wicked plunge. Firstly, we had been long Oil since the end of April from a price of 103.54. As of Wednesday May 2, we had open profits accruing to the tune of around $1800 dollars per contract on long positions.
Upon Wednesday's 106.43 pivot high failing to reach our 107 price-target, we illustrated boundary to a 1 ½ -pt sell trigger, which similar to the 107 target, was a technical setup that we provide for ancillary benefit outside the purview of our automated trading strategy.
Secondly, on Thursday May 3, our subscribers received a bearish email alert that confirmed, and we booked $1240 dollars in profit on long positions and reversed short at 104.78 on cue from our proprietary trading strategies algorithms.
As an aside, the ancillary sell trigger citing 1 ½ points of downside captured its target easily amidst trade beneath its 103.65 downside projection.
Note that from $1830 the day prior, that our daily equity has now risen to $3,552 dollars per contract. Furthermore, our month-to-date equity is also to the plus column with a reading north of $2,312 dollars per contract traded.
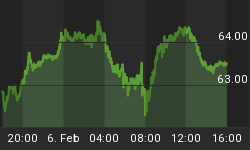
Last, we will close out with Friday's chart, which illustrates a quintessential all-at-once waterfall decline from which; our strategy was in perfect position to take full advantage.


All told by Friday's close, our short positions taken just one day prior, carry open profits of $6,100 dollars per contract traded.

So how are our Chart-Cast Pilot subscribers faring in the rest of the broad markets? See for yourself:
We suspect the spreadsheet above speaks for itself. How are you faring with your efforts and strategy's?
In closing, we leave you with a parting visual of enduring wisdom, which are our motto and our creed.

Yes, it is that simple!
Until Next Time,


