• 618 days Will The ECB Continue To Hike Rates?
  • 619 days Forbes: Aramco Remains Largest Company In The Middle East
  • 620 days Caltech Scientists Succesfully Beam Back Solar Power From Space
  • 1,020 days Could Crypto Overtake Traditional Investment?
  • 1,025 days Americans Still Quitting Jobs At Record Pace
  • 1,027 days FinTech Startups Tapping VC Money for ‘Immigrant Banking’
  • 1,030 days Is The Dollar Too Strong?
  • 1,030 days Big Tech Disappoints Investors on Earnings Calls
  • 1,031 days Fear And Celebration On Twitter as Musk Takes The Reins
  • 1,033 days China Is Quietly Trying To Distance Itself From Russia
  • 1,033 days Tech and Internet Giants’ Earnings In Focus After Netflix’s Stinker
  • 1,037 days Crypto Investors Won Big In 2021
  • 1,037 days The ‘Metaverse’ Economy Could be Worth $13 Trillion By 2030
  • 1,038 days Food Prices Are Skyrocketing As Putin’s War Persists
  • 1,040 days Pentagon Resignations Illustrate Our ‘Commercial’ Defense Dilemma
  • 1,041 days US Banks Shrug off Nearly $15 Billion In Russian Write-Offs
  • 1,044 days Cannabis Stocks in Holding Pattern Despite Positive Momentum
  • 1,045 days Is Musk A Bastion Of Free Speech Or Will His Absolutist Stance Backfire?
  • 1,045 days Two ETFs That Could Hedge Against Extreme Market Volatility
  • 1,047 days Are NFTs About To Take Over Gaming?
Another Retail Giant Bites The Dust

Another Retail Giant Bites The Dust

Forever 21 filed for Chapter…

Is The Bull Market On Its Last Legs?

Is The Bull Market On Its Last Legs?

This aging bull market may…

The Problem With Modern Monetary Theory

The Problem With Modern Monetary Theory

Modern monetary theory has been…

  1. Home
  2. Markets
  3. Other

Crude Oil: More to the Story

In our Chart Book, which is a new weekly addition to TheTechnicalTake line up, I highlighted a chart of the i-Path Goldman Sachs Crude ETN (symbol: OIL). The chart pattern was bearish as price was breaking down out of 3 year range and below two key pivot points. This is shown in figure 1, a weekly chart of OIL. But as always there is more to the story.

Figure 1. OIL/ weekly

Larger Image

I suspect that the break down in crude oil is reflective of the fact that the US economy is headed into recession. Economic indicators are pointing towards a recession, and I believe the poor action in crude oil only confirms this. Two fundamental inputs that are crude positive are economic strength and rising yield pressures. Neither of these dynamics are seen in the current economic environment. Crude could be considered a hedge against the lunacy of central bankers to inflate assets and devalue currency, but the Fed is doing more of the same for now, and Europe can't seem to get its act together.

From a fundamental perspective, there seems to be little reason to to own crude oil. The technical picture is also negative. Look for OIL to drop another 20% and possibly retest the 2009 lows. A weekly close above the 20.38 pivot would invalidate this analysis.


Addendum

At the request of one our more astute readers who posted some comments in the above article, here is a weekly chart of West Texas Intermediate crude oil. See figure 2.

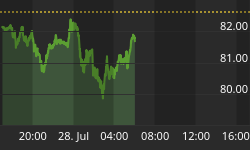
Figure 2. WTI/ weekly

Larger Image

The story -economic contraction - remains the same as crude oil is breaking down. A weekly close above 80.94 would invalidate this analysis. Otherwise, I would expect crude oil to reach the next support level near $70.


Back to homepage

Leave a comment

Leave a comment