


Our use of intermarket analysis has kept us on the right side of the changing trends of 2005. In our weekly report on March 13, 2005 we wrote: "The topping process in stocks may have ended this week as surging yields drained liquidity from the system. The dollar continued to selloff, but we view this simply as a "test" of the lows before the greenback rallies above its January highs, causing pain to stock market bulls."
In fact, it is our work with the dollar and gold stocks that led us to believe that stocks would put in a major top in the first quarter of 2005. The ebb and flow of liquidity (as measured by gold stocks) has been an excellent indicator for the stock market as a whole.
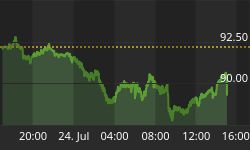
Below is a chart of the XAU Gold and Silver Index that we originally published for readers of FxMoneyTrends.com on February 5, 2005. We said that if gold stocks represent "liquidity expectations," then the XAU must rally to new highs with the broader stock market to confirm a continuation of the "reflation trade." If it does not, then we should expect a MAJOR top in both the XAU and the S&P 500.
As you can see, we forecasted a countertrend move in the XAU six weeks prior to the stock market top indicating that if the XAU failed to rally past its December highs it would not confirm new highs in the S&P500. In turn this would indicate to us it was finally safe to get short the stock market which we did do later that week.


As we now know, stocks have sold off sharply while the XAU has broken below rising trendline support from the July 2002 lows. The structure of the decline has also conformed perfectly to our forecast of an "ABC" decline by rallying strongly in "wave B" in February to our target level of 100 and then falling sharply on its way to our target of 75 which should be reached over the coming months.


We view the current rally as nothing more than a correction towards the underside of broken trendline support now crossing at 90. Any rally past here should only carry to 95 or so before the next sharp decline carries prices towards our longstanding target of 75 which we think will provide the next excellent buying opportunity in gold and silver stocks.
Dollar Seasonality the Key to Market Trends in 2005
To further corroborate our view that the dollar index has put in an important low and that gold stocks will continue to decline over the near term, we will next show a study of the stock market bottom of 2002-03 and the dollar index bottoming process of 2004-05.
The chart below is from the same March 13, 2005 report we alluded to at the beginning where we called for a major top in both the XAU and the broader stock market. As you can see, because we knew in advance that the dollar has seasonal strength in the month of March and we were looking for a rally. We will get to that part later. Here is what we said in the March 13 report:
"Below we have labeled the "three tests" of the dollar and S&P 500 lows. Recall that the 775 level in the S&P 500 marked the exact 61.8% retracement of the rally from the 1991 recession lows of 285 to the 2000 mania top at 1565. As such, this provided the springboard for a bottom. Also note that prices are now topping out near the exact 61.8% retracement of the 1565 highs to the 775 lows at 1263 at 1230. The S&P 500 has come to within one percent of these highs last week and may therefore have topped out already."
"Similarly, the dollar index bottomed three previous times around the 80 level and a break below here would likely spell the end of dollar hegemony. We do not buy that argument - yet - and we therefore see the 80 level acting as a similar springboard for the dollar as the 775 level did for the S&P 500. Also recall just how bearish people were in late 2002 on the stock market. The bears were in control then but paid the price by staying short the market. We feel the same is in store for dollar bears in 2005."

The reason we feel so confident about our outlook on gold stocks and thus the broader equity market is because our primary focus is the currency market and how it affects stocks, interest rates and commodities.
Readers of our free daily reports on the dollar index know that the dollar is now declining from the 85.25 level just as we said it would three weeks ago. We are well on the way to our target of 83.50/82.50 where we think traders will want to start building up an aggressive long dollar position with risk limited to below the 81.20 lows for a move towards 88/90 over the coming weeks. This is a great setup that should be very profitable to those who execute it correctly.
Of course, many will ask how we can be so confident about an upcoming move in the currency market? To answer that we have updated a study of the dollar index's seasonality that we first showed four months ago to say that January was the best month of the year to get long. We then warned during the dollar's sharp January rally to take profits the first week of February and to watch for a 50% correction of those gains.

The dollar index retraced in February and rallied again in March -exactly in line with its seasonal trends. Now it is falling hard in April, just as seasonal patterns suggested it would. Truly amazing!
If past trends continue to hold sway we expect to see further weakness into the end of April followed by the next great surge in the dollar between May and June. In the bottom chart we have attached the seasonal pattern to the current price action in the USD index.
If the dollar were to follow its seasonal trend exactly, we should see a relief rally in USD this week followed by a renewed decline to 82.50. Our Elliott Wave outlook confirms this view as one should expect an "ABC" type decline from the 85.25 highs targeting the 83.50/82.50 level over the coming days to weeks.
At this level we will accumulate dollar longs and warn buyers of gold stocks to watch out for a renewed decline if the dollar's seasonal pattern holds true.
Recent Testimonial for FX Money Trends: "I find FX Money Trends' work extremely helpful. As a macro hedge fund manager I base my success on ideas generated both internally and through external research services: FX Money Trends and its founder Jes Black constantly provide ideas which are based both on very clever fundamental and technical analysis and research. FX Money Trend's intellectual independence makes their ideas precious, never obvious nor "late." - Francesco Clarelli, Italy.


