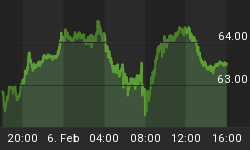
The two most popular investments a few years ago have been dormant and out of the spot light. But from looking at the price of both gold and oil charts their time to shine may be closer than one may thing.
Seasonal charts allow us to look at what the average price for an investment does during a specific time of the year. The gold and oil seasonal charts below clearly show that we are entering a time which price tends to drift higher.
While these chart help with the overall bias of the market keep in mind they are not great at timing moves and should always be coupled with the daily and weekly underlying commodity charts.
Now, let's take a quick look at what the god father of technical/market analysis shows in terms of market cycles and where I feel we are trading... As I mentioned last week, a picture says a thousand words so why write when I can show it visually J
John Murphy's Business Cycle:

Mature Stock Market:

Commodity Index Looks Bullish and Should Rise:

Gold & Silver Seasonality, Price Charts w/ Analysis:

Precious Metals like gold and silver are nearing a bounce and possible major rally in the second half of this year.


Crude Oil Seasonality, Price Chart w/ Analysis:

Crude oil has been a tough one to trade in the last year. The recent 15 candles have formed a bullish pattern and with the next few months on the seasonal chart favoring higher prices it has been leaning towards the bullish side.

Commodity, Gold & Oil Cycle and Seasonality Conclusion:
In short, I feel the equities market is nearing a significant top in the next couple weeks. If this is the case money will soon start flowing into commodities in general as more of the safe haven play. To support this outlook I am also factoring in a falling US dollar. Based on the weekly dollar index chart it looks as though a sharp drop in value is beginning. This will naturally lift the price of commodities especially gold and silver.
It is very important to remember that once a full blown bear market is in place stocks and commodities including gold and silver will fall together. I feel we are beginning to enter a time with precious metals will climb but it may not be as much as you think before selling takes control again.
Final thought, this could be VERY bullish for the Canadian Stock Market (Toronto Stock Exchange) as it is a commodity rich index. While the US may have a pullback or crash Canadian stocks may hold up better in terms of percentage points.
Get My Daily Video, Updates & Alerts Here: www.TheGoldAndOilGuy.com


