
This week's Chart of the Week video looks at the stock market's reaction to this past week's FOMC announcement.
So let's get technical!
"No warning can save people determined to grow suddenly rich" - Lord Overstone
 |
Gold •748 days | 2,368.70 | +35.30 | +1.51% |
|
Platinum •10 mins | 1,632.10 | +28.10 | +1.75% |
|
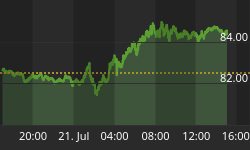
WTI Crude •11 mins | 84.36 | +1.88 | +2.28% |
|
Gasoline •11 mins | 3.420 | +0.031 | +0.90% |
|
Ethanol •748 days | 2.161 | +0.000 | +0.00% |
|
Silver •748 days | 30.82 | +1.16 | +3.92% |
 |
Silver • 748 days | 30.82 | +1.16 | +3.92% | |
|
Copper • 748 days | 4.530 | +0.111 | +2.51% | |
|
Brent Crude • 11 mins | 91.11 | +1.89 | +2.12% | |
|
Natural Gas • 11 mins | 2.852 | -0.008 | -0.28% | |
|
Heating Oil • 11 mins | 4.129 | +0.010 | +0.24% |

During the quarter there were…

More freeports open around the…

Forever 21 filed for Chapter…
This week's Chart of the Week video looks at the stock market's reaction to this past week's FOMC announcement.
So let's get technical!
Sign up to the


